No upward drivers on global bunker market so far
World fuel indexes have demonstrated traditional losses during the week: oil prices are now at a 7-month low. Downward evolution has all the chances to be extended as U.S. shale drillers continue to add rigs, and Libya and Nigeria ramp up production, undermining their fellow OPEC members’ efforts to reduce output and support prices.
MABUX World Bunker Index (consists of a range of prices for 380 HSFO, 180 HSFO and MGO at the main world hubs) has declined slightly in the period of Jun. 15 – Jun. 21 as well:
380 HSFO – down from 279.43 to 275.64 USD/MT (-3.79)
180 HSFO – down from 319.79 to 315.93 USD/MT (-3.86)
MGO – down from 474.00 to 465.50 USD/MT (-8.50)
There are increasing signs that declining inventories in the U.S. won’t compensate rising domestic production or increasing output by other non-OPEC states. The IEA reported that total OECD inventory levels increased by more than the seasonal norm in April. Crucially, inventories in the OECD have actually grown year-to-date, despite five months’ worth of OPEC cuts. Non-OPEC supply is expected to grow by 1.5 million barrels per day (bpd) in 2018, which is a larger volume than the total expected increase in worldwide demand.
Another downward driver for fuel prices is the deficit between supply and demand. Last month, the IEA reported that demand was outstripping supply by about 0.7 million bpd, but in its June report, the agency cut that figure to 0.5 million bpd: a sign that the oil market tightening is underway.
However, the main factor pushing prices lower is still a steady rise in U.S. production undermining the OPEC-led effort. Shale production in the U.S. is up more than 700,000 bpd since bottoming out in September 2016, rising steadily to 9.33 million bpd in June. The IEA expects U.S. oil production could end 2017 up 920,000 bpd from a year earlier and could grow by another 780,000 bpd in 2018. Those figures would likely prevent any rally in oil and fuel prices. However, the industry might not get that far because they could push down prices this year, which could potentially slow down ambitious production plans.
The amount of oil stored in tankers reached a 2017 high of 111.9 million barrels earlier this month. Higher volumes of storage in the North Sea, Singapore and Iran account for most of the increase. Almost 9 million barrels of key crude are now floating on Aframax vessels and crude supertankers off the U.K.’s coasts. The tankers have been floating from less than a week to over two months. The region’s inventories on ships last increased in March, before receding again. All in all oil in floating storage has been building at a rate of about 800,000 barrels a day since early May and continues to increase. More than 52 million barrels a day have been loaded onto tankers this month, a record since at least 2012.
Besides, full compliance from OPEC is still not guaranteed. Iraq has only logged a 55 per-cent compliance rate, a figure that could fall in the coming months as it potentially increases its production capacity. More importantly, Nigeria and Libya have increased output, restoring disrupted projects and promising to bring even more online in the remainder of 2017.
Russian compliance with the first round of cuts was slow, and there is skepticism that Moscow will offer aggressive compliance this time although Russian news has reported companies have successfully cut 300,000 bpd.
The political confrontation between Qatar and other countries in the Middle East enters its third week, and the conflict shows no signs of abating. On June 5, Saudi Arabia, Egypt, the UAE and Bahrain cut diplomatic ties with Qatar and also tried to close off entry to Qatar by land, sea and air. They argued that Qatar is a major funder of terrorism. For now, the struggle has not yet led to a major disruption in the flow of oil and gas. However, a broader region-al conflict would have huge implications for oil and fuel prices.
Recent attacks against merchant shipping in the Gulf of Aden and Bab Al Mandeb (the route for 4 million barrels of oil to Middle Eastern markets everyday), have highlighted that there are still risks associated with transits through these waters, supporting price indexes. The total number of incidents is still far below figures from 2011, a period in which Somali pirates carried out 237 attacks and took hundreds of people hostage. Anyway, for the main opponents in Yemen crisis – Iran and Saudi Arabia – tight control over the strait equates to domination of African energy markets, which expect to see exponential growth in oil and natural gas demand in the next decade.
An addition pressure was exerted from Libya’s announcement that its crude oil production has hit 885,000 bpd after the unblocking of some 160,000 bpd in daily production, shuttered during a dispute between the Libyan National Oil Corporation and German Wintershall. Exempted from OPEC’s production agreement, Libya is eager to raise its production as quickly as possible, targeting 1 million bpd by the end of July.
There are also indicators that demand growth in Asia, the world’s biggest oil-consuming region, is slowing down. Japan’s customs-cleared crude oil imports fell 13.5 percent in May from the same month a year earlier, to 2.83 million bpd. India, which recently overtook Ja-pan as Asia’s second-biggest oil importer, took in 4.2 percent less crude oil in May than it did a year ago.
China’s crude output level was 3.83 million bpd in May, down by 3.7 percent year on year, to the lowest domestic production volume since 2011. China’s crude imports in May surged by 15.4 percent on the year to 8.8 million bpd. The jump in imports was mostly attributed to state refiners’ imports. However, it is expected that imports would slow in June because inventories are high, and then increase again in July due to the peak demand for oil products in the summer.
All in all prices are still slipping down with no any upward drivers so far. Global fuel market remains skeptical of OPEC’s and its partners’ ability to restore balance in demand and supply while U.S. producers continue to ramp up production. We expect global bunker prices will continue slight downward evolution next week.
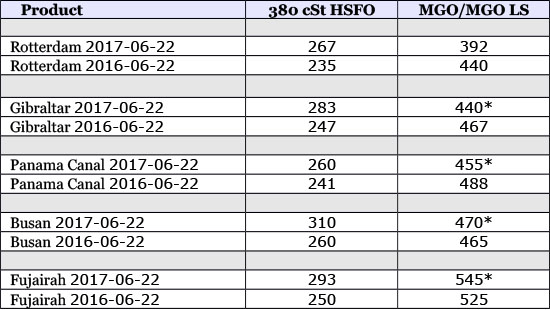
* MGO LS
All prices stated in USD / Mton
All time high Brent = $147.50 (July 11, 2008)
All time high Light crude (WTI) = $147.27 (July 11, 2008)

Source: Marine Bunker Exchange
HEADLINES
- Do shipping markets want Biden or Trump for the win?
- All 18 crew safe after fire on Japanese-owned tanker off Singapore
- Singapore launching $44m co-investment initiative for maritime tech start-ups
- Cosco debuts Global Shipping Industry Chain Cooperation Initiative
- US warns of more shipping sanctions
- China continues seaport consolidation as Dalian offer goes unconditional