China’s seaborne trade: a spectacular upwards trend
Brisk growth in China’s enormous seaborne trade has resumed over the past couple of years, following an earlier sharp slowing of the upwards trend. Potential for further expansion ahead is still visible, but it is not easy to foresee precisely how some aspects will evolve. Adding to the mix a trade dispute with adverse implications magnifies uncertainty about prospects.
The evolution of this global seaborne trade component is particularly fascinating, given its extra-large size and its substantial contribution to overall trade expansion. China’s imports have grown to comprise more than one-fifth of the world total. During the past decade, half of the rise in global cargo volumes moved was contributed by additional import volumes into China.
Shipping story of the century
Although identification of the most significant twenty-first century shipping story is to some extent a matter of opinion, the impact of China’s expanding seaborne trade is in strong contention for the title. The ramifications for both the demand and, in turn, supply sides of the world shipping market have been massive.
Rising imports into China were a powerful contributor to the pre-2008 period of strong global shipping markets. The extended dry bulk freight market ‘boom of two lifetimes’ ending in 2008 reflected this influence. Subsequently, during the past decade since that strong market phase, imports into China have provided valuable support for the bulk carrier, tanker, container ship and gas carrier markets. Arguably that support encouraged shipowners’ collective over-estimation of seaborne trade growth potential in the past ten years, resulting in excessive world fleet growth, severe over-capacity and subdued freight markets for most of the period.
A few statistics emphasise these observations. The main focus of attention is on the imports picture, as it is in this category where the biggest impact has been seen. Among exporters, China is also a sizeable element which has grown during the past decade and over a longer period, but this enlargement was relatively small.
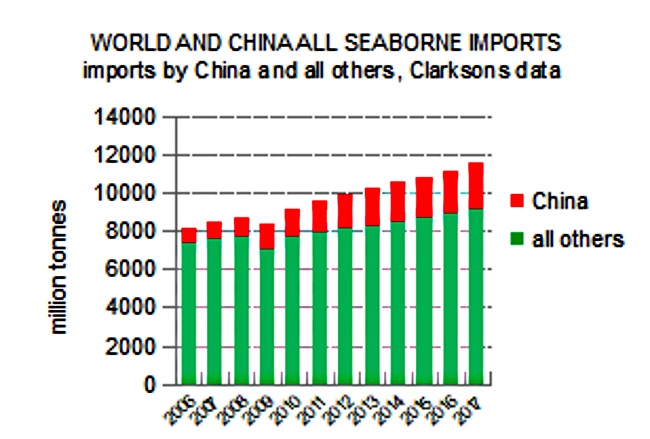
The upwards trend in imports has been remarkable. In 2017, seaborne imports of all types of cargo into China (dry bulk commodities, oil, gas, containerised shipments and other cargoes) grew by 182 million tonnes or 8 percent from the previous year according to Clarksons Research calculations. This increase followed a 7 percent rise in 2016.
Annual growth rates in the past ten years varied between 1 percent in 2015 (the slowest) and 37 percent in 2009 (the fastest). The 2009 upsurge was an exceptional year, resulting from vigorous expansion of the Chinese economy and industry which greatly assisted the world’s recovery from depression. Apart from that unusual performance, the highest growth rates in China’s imports of all cargo types were in 2011 to 2013, when 11-12 percent annual rises were seen. Average annual growth in the entire 2007 to 2017 period was 10.2 percent.
Bumper imports, solid exports
Looking in more detail at the expansion over the past decade reinforces an impression of a truly remarkable upwards trend. Annual imports of all seaborne cargoes into China rose by 163 percent from the 2007 volume, reaching 2437mt in 2017. Dry bulk commodity imports, the largest element, was the fastest growing category over the ten years, expanding by 191 percent to 1730mt. The second largest component, oil (crude plus products), saw a 129 percent increase to 416mt. In the containerised goods segment, growth was 43 percent to 117mt. All other cargo together increased by 149 percent to 175mt.
Relating the expansion of China’s overall imports to the performance of world seaborne trade as a whole is revealing. Annual imports of all types of cargo into China grew by 1510mt in the ten years ending 2017, equivalent to 49 percent of world imports growth, based on Clarksons Research data. Annual imports into all other countries together grew by 1593mt, or 51 percent of world imports growth. So it can be seen that China contributed almost as much to the enlargement of global trade as other countries together during that period.
Consequently, China’s imports (all cargo types) rose as a percentage of global seaborne trade. From 11 percent of the world total in 2007 (and, earlier, 5-6 percent in the early 2000s), the proportion almost doubled to a 21 percent share in 2017.
Comparing exports with imports, export volumes are less than one quarter of the imports totals. Growth in China’s annual seaborne exports of all cargoes was a modest 19 percent during the past ten years. The total reached 563mt in 2017. There was a 3 percent decline last year after a couple of modest rises. The largest category is dry bulk cargoes, comprising two-fifths, while container cargoes are almost as large.
This brief statistical tour demonstrates the role of China, with an enlarged share of global seaborne trade. Coupled with providing one-half of the increased global trade volume during the past decade, the attention which the trend attracts in shipping markets is justified.
Powerful macro-economic drivers
Several general, and some more specific, influences have been instrumental in buoying up the vigorous China trade trend. Assisting this pattern was the all-pervading influence of the national economy’s robust progress, and the features of that sustained performance.
While showing a decelerating trend over the past decade, China’s economy nevertheless avoided any extended severely weak periods and momentum was mostly well-supported. There were phases where anxiety (especially among external observers) about prospects was heightened by signs of negative influences becoming more prominent. Firmer conditions were restored, usually with assistance from government stimulus programmes and, based on the official GDP figures, any deterioration was contained.
Double-digit annual percentage rises in GDP ended, with one exception, before the global financial crisis and recession. But even at the nadir of that crisis in 2008 and 2009, China was able to achieve healthy 9.6 percent and 9.2 percent annual growth respectively, albeit a sharp slowdown from 14.2 percent in 2007. The exception to the subsequent pattern of below ten percent rates was a brief revival to 10.6 percent in 2010 when the world was recovering.
Thereafter a slackening trend became entrenched. After a still robust 9.5 percent in 2011, slower growth became the norm. From 2012 to 2014 an annual average 7.7 percent was recorded, followed by a 6.8 percent average from 2015 to 2017. Other economic activity indicators in China were broadly consistent with this evolving pattern. Despite doubts among external economists about how accurately reported Chinese official GDP figures reflect the true picture of economic activity unfolding, it has been clear that many large components have continued growing strongly, with variations.
Modifying aspects
What other, more direct, influences have contributed to China’s seaborne trade trend? Mostly these influences have been positive. Growing imports reflected vigorous consumption trends as expanding demand for the products of individual industries spurred rising output volumes. When domestic production of the raw materials – such as iron ore, coal, crude oil and gas – proved increasingly inadequate, imports were needed on an enlarging scale. Foreign supplies were often more competitive than domestic supplies, resulting from superior quality or lower cost, or both.
HEADLINES
- Do shipping markets want Biden or Trump for the win?
- All 18 crew safe after fire on Japanese-owned tanker off Singapore
- Singapore launching $44m co-investment initiative for maritime tech start-ups
- Cosco debuts Global Shipping Industry Chain Cooperation Initiative
- US warns of more shipping sanctions
- China continues seaport consolidation as Dalian offer goes unconditional