Tianjin Shipping Index (Jan.8-Jan.12)
I. Tianjin Shipping Index (TSI)
In Week 2 (Jan.8-Jan.12), Tianjin Container Freight Index (TCI) increased and then decreased. Tianjin Bulk Freight Index (TBI) kept decreasing. Tianjin Domestic Container Freight Index (TDI) kept stable. Tianjin Shipping Index (TSI) increased and then decreased. The TSI closed at 641.81 points with a decrease 1.80% from Jan.5 (the last release day of Week 1). The TSI trend is as follows,
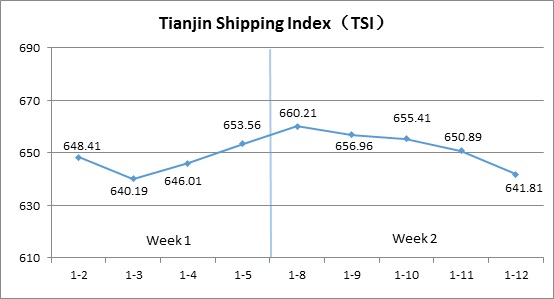
The chart above shows the trends of TSI from Jan.2 to Jan.12. The value of TSI in Week 2, 2018 is as follows,
II. Tianjin Container Freight Index (TCI)
In Week 2, 2018 (Jan.8 to Jan.12), The trend of TCI is as follows,
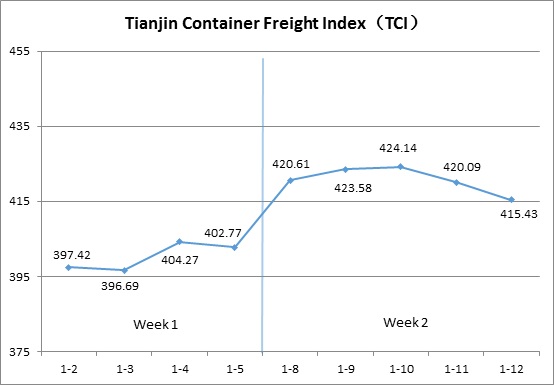
In Week 2, the TCI increased and then decreased.
From Jan.8 to Jan.10 (Mon. to Wed.), the freight rates in European route, Mediterranean route and Persian Gulf route increased markedly. The freight rates in North American route increased and then decreased. The freight rates in South American West Coast route and Central South American route decreased and then increased. The freight rates in South American East Coast route decreased rapidly. The TCI kept increasing by 5.31% on three consecutive release days. From Jan.11 to Jan.12 (Thu. to Fri.), the freight rates in European route, Mediterranean route and South American East Coast route decreased. The freight rates in North American route stabilized. The freight rates in South American West Coast route, Central South American route and Persian Gulf route increased markedly. The TCI decreased sharply by 2.05% on two consecutive release days.
The TCI closed at 415.43 points with an increase of 12.66 points (3.14%) from Jan.5 (the last release day of Week 1).
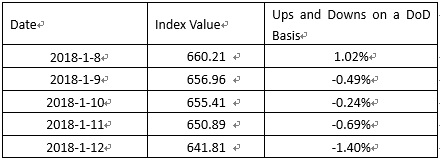
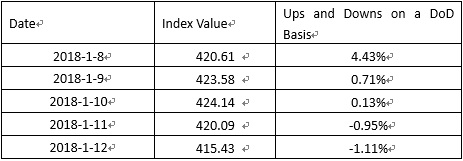
The TCI index value saw several up and down on a day-on-day basis are as follows:
European/Mediterranean route With Spring Festival coming, cargo volume from factories increased and some shipping alliances carried out the freight-rate-rising plan. Then, the ship owners reduced the freight rates to increase shipping loading rate. Finally, the freight rates in European route increased markedly by 6.53% on a week on week basis. In later half of the week, because of the great effort to increase the freight rate, the freight indices decreased 0.32% and 3.17% on a week on week basis.
North American route After the ship owners raised the freight rate last week, other ship owners followed their steps and the freight rates increased. In mid and later half of the week, supply-demand on the market was balanced and the freight rates were stable. The freight indices in North American West Coast route and North American East Coast route increased 1.76% and 5.53% this week.
South American route In South American West Coast route and Central South American route, cargo volume increased. The shipping alliances reduced the shipping frequency and the freight rates increased markedly after the slight decrease in first half of the week. The freight indices increased 13.09% and 7.15% this week. In south American East Coast route, the freight rates increased by 40% since last October and pressure of decrease exists. The freight rates presented a weak trend this week and decreased 8.86% on a week on week basis.
Persian Gulf route Since Nov.2017, some ship owners who mainly do short-range ocean transport marched to Persian Gulf route. The supply-demand was out of balance and the freight rates kept reaching new record low. At the beginning of 2018, some shipping companies increased the freight rates under pressure. This week, more and more ship owners followed their steps and the freight rates increased markedly. The freight indices increased 25.36% on a week on week basis.
III. Tianjin Bulk Freight Index (TBI)
Week 2, 2018 (Jan.8 – Jan.12), Tianjin Bulk Freight Index (TBI) is shown as follows:
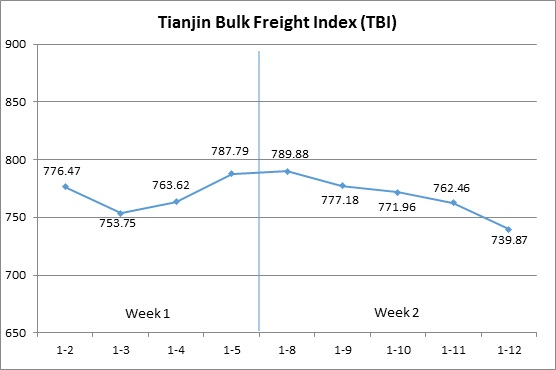
In week 2, the TBI decreased continuously.
On Jan.8 (Mon.), the freight rates of coal, grain and mineral ore all increased slightly and the TBI increased 0.27% on a day-on-day basis. Then, the freight rates of coal and grain went down slightly and the freight rate of mineral ore decreased fast, which led the TBI to decrease 3.47% from Jan.9 to Jan.11 (Tue. to Thu.)
On Jan.12 (Fri.), the decrease of the freight rate of coal accelerated and the freight rates of grain and mineral ore continued to decrease. TBI decreased continuously and ended at 739.87 points with a decrease of 47.92 points (6.08%) from Jan.5 (the last release day of week 1).
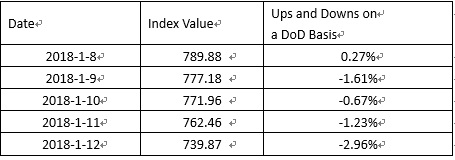
TBI index value saw several ups and downs on a day-on-day basis, which is shown as follows:
TBCI first increased and then decreased this week. TBCI ended at 565.13 points with a decrease of 18.90 points (3.24%) from Jan.5 (the last release day of week 1). Domestic coal demand increased, which supported the freight rate of coal imports. For the Panamax market, the freight rate of the DBCT to Tianjin route increased continuously earlier this week but decreased later and the total increase was about 0.1%. The Capesize market was not active and the freight rate decreased significantly. The freight rate of Hay Point to Qingdao route decreased about 7.5%.
TBGI increased in the first half of the week but decreased slightly later. It ended at 682.41 points with an increase of 3.15 points (0.46%) from Jan.5 (the last release day of week 1). The freight rate of grain was stable as a whole and the grain trade in South America made the freight rate in Atlantic market increase. The freight rate of South America to Tianjin route increased over 0.8%. The freight rate of US Gulf to Tianjin route increased over 0.5%. By contrast, the freight rate of West America to Tianjin route decreased about 0.9%.
TBMI decreased significantly this week. It ended at 972.07 points with a decrease of 128.00 points (11.64%) from Jan.5 (the last release day of week 1). For the iron ore market, the shipment of the port Hedland in Australia was affected by typhoon and the market was gloomy. The freight rate decreased further and the freight rate of West Australia to North China route decreased over 16%. The freight rate of Brazil to Tianjin route decreased about 6%. As for nickel ore, port congestion in Indonesia made the freight rate of Handysize increase and the freight rate of Surigao to Tianjin route increased about 1% this week.
IV. Tianjin Domestic Container Freight Index (TDI)
In the second week of 2018 (Jan.8-12), the trend of the TDI is as follows
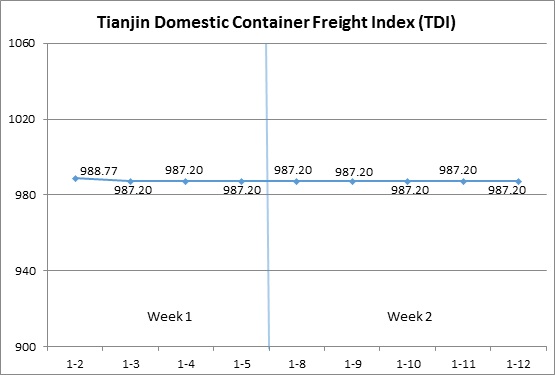
In the second week, Tianjin Domestic Container Freight Index (TDI) remained stable.
This week, the Inward and Outward Index (H-Share Index) all maintained a steady trend. TDI ended at 987.20 points, unchanged from January 5 (the last release day of Week 1)
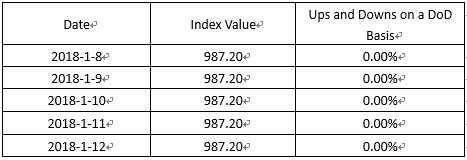
The value of TDI ups and downs on a day-on-day basis are as follows:
Tianjin Domestic Container Outward Freight Index (TDOI) was stable with the index closing at 1153.13 points on January 12, unchanged from January 5 (the last release day of Week 1). After a drastic adjustment in the end of 2017, the freight rates of three routes from North to South continued their steady trend last week. Tianjin to Quanzhou, Tianjin to Guangzhou, Tianjin to Shanghai route freight index was unchanged on a week-on-week basis.
Tianjin Domestic Container Inward Freight Index (TDII) remained stable. The index closed at 821.09 points on Jan.12, unchanged from January 5 (the last release day of Week 1). The trading volume of the three northern routes was light and the freight rate remained stable this week. The freight index of the three sub-routes was unchanged on a week-on-week basis.
HEADLINES
- Do shipping markets want Biden or Trump for the win?
- All 18 crew safe after fire on Japanese-owned tanker off Singapore
- Singapore launching $44m co-investment initiative for maritime tech start-ups
- Cosco debuts Global Shipping Industry Chain Cooperation Initiative
- US warns of more shipping sanctions
- China continues seaport consolidation as Dalian offer goes unconditional