Tianjin Shipping Index(Feb.12-Feb.23)
I. Tianjin Shipping Index (TSI)
From Week 7 to Week 8 (Feb.12-Feb.23), because of Spring Festival holiday, Tianjin Shipping Index released five times. Tianjin Container Freight Index (TCI) kept decreasing. Tianjin Bulk Freight Index (TBI) increased with shocks. Tianjin Domestic Container Freight Index (TDI) kept stable. Tianjin Shipping Index (TSI) fluctuated slightly. The TSI closed at 608.15 points with an increase of 0.34% from Feb.9 (the last release day of Week 6). The TSI trend is as follows,
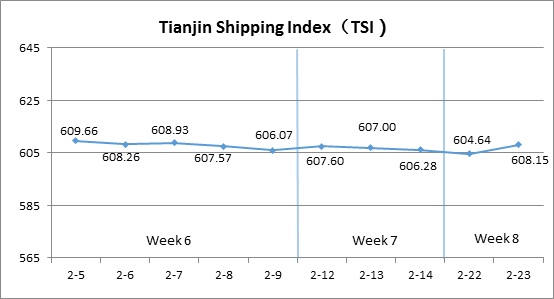
The chart above shows the trends of TSI from Feb.5 to Feb.23. The value of TSI in Week 7 to Week 8, 2018 is as follows,

II. Tianjin Container Freight Index (TCI)
In Week 7 to Week 8, 2018 (Feb.11 to Feb.24), because of Spring Festival holiday, the TCI released 7 times and the trend of TCI is as follows,
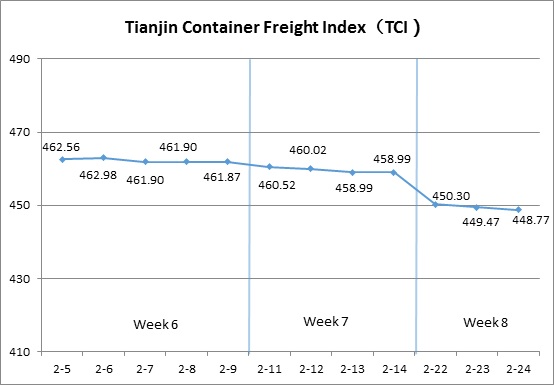
From Week 7 to Week 8, the TCI decreased slightly.
From Feb.11 to Feb.14 (Week 7), the freight rates in European route, Mediterranean route, North American route, South American West Coast route and Persian Gulf route stabilized and decreased. The freight rates in South American East Coast route and Central South American route kept stable. The TCI decreased slightly by 0.62% on four consecutive release days. From Feb.22 to Feb.24 (Week 8), the freight rates in European route, Mediterranean route, North American route, South American route and Persian Gulf route kept the decrease trend. The decrease range of TCI became larger and the decrease was 2.23% on three consecutive release days.
The TCI closed at 448.77 points with a decrease of 13.10 points (2.84%) from Feb.9 (the last release day of Week 6).
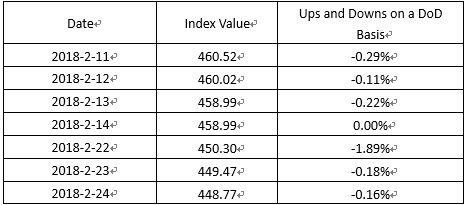
The TCI index value saw several up and down on a day-on-day basis are as follows:
European/Mediterranean route With Spring Festival coming, factories and land transportation companies stared their vacation. Cargo volume decreased markedly. The freight rates presented a decline trend. The freight indices in European route, Mediterranean East Coast route and Mediterranean West Coast route decreased 2.59%, 0.27% and 2.73% in two weeks.
North American route Freight transportation demand released before Spring Festival. Since week 7, cargo volume kept decreasing. Some shipping alliances cut the shifts to alleviate the pressure of overcapacity. The freight rates decreased slightly in week 7 and week 8. The freight indices in North American West Coast route and North American East Coast route decreased 2.63% and 1.15% in two weeks.
South American route Cargo volume was in a low level and the ship owners reduced transport capacity. But the pressure of cargo collection was still high. The freight rates presented a weak trend. The freight indices in South American West Coast route, South American East Coast route and Central South American route decreased 6.69%, 0.97% and 2.20% in week 7 and week 8.
Persian-Gulf route Since 2018, the freight rates increased markedly by nearly 50% at the end of week 6. In week 7, the freight rates stopped the increase trend. Some shipping companies reduced the freight rates to guarantee loading rate and the freight indices decreased 4.75% in two weeks.
III. Tianjin Bulk Freight Index (TBI)
Week 7 - Week 8, 2018 (Feb.12 – Feb.23), Tianjin Bulk Freight Index (TBI) was released 5 times due to the Spring Festival holiday arrangement and the trend is shown as follows:
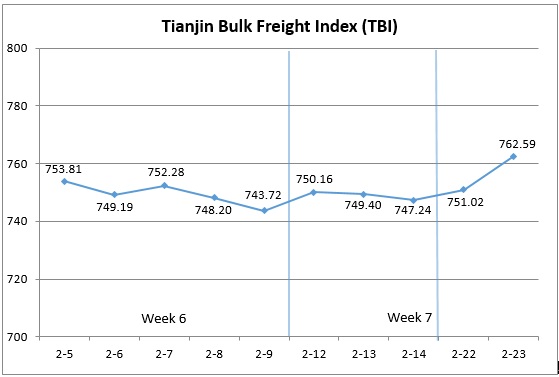
In week 7-week 8, the TBI shocked narrowly before Spring Festival holiday but it increased after the holiday.
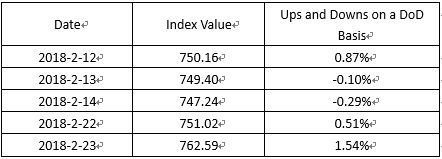
On Feb.12 (Mon. of Week 7), the freight rates of coal and mineral ore increased, which led the TBI to increase 0.87%. Then, the freight rates of coal, grain and mineral ore decreased. TBI decreased slightly from Feb.13 to Feb.14 (Tue. to Wed.) and the total decrease was 0.39%.
On Feb.22 (Thu. of Week 8), the freight rates of coal, grain and mineral ore all increased and the TBI increased 0.51% on a day-on-day basis. On Feb.23 (Fri. of Week 8), the freight rates of coal and mineral ore increased, which led the TBI to increase again. It ended at 762.59 points with an increase of 18.87 points (2.54%) from Feb.9 (the last release day of week 6).
TBI index value saw several ups and downs on a day-on-day basis, which is shown as follows:
TBCI shocked narrowly before the holiday but increased continuously after the holiday. TBCI ended at 580.91 points with an increase of 17.60 points (3.12%) from Feb.9 (the last release day of week 6). For the Panamax market, the market was gloomy before the festival. The market recovered slowly after the holiday and the shipment demand increased. The freight rate of the DBCT to Tianjin route increased over 3% within two weeks. The freight rate of the Capesize kept increasing during the holiday and the freight rate of Hay Point to Qingdao route increased about 3%.
TBGI decreased before the festival but increased slightly after the holiday. It ended at 678.98 points with an increase of 3.86 points (0.57%) from Feb.9 (the last release day of week 6). Before the holiday, the cargo volume of grain in South America was small and there were many carriers in ballast in the market, then the freight rate of grain decreased continuously. After the holiday, cargo of grain in South America increased significantly and the Atlantic market was active. The freight rate of South America to Tianjin route increased over 0.8%. The freight rate of US Gulf to Tianjin route increased about 0.4%. Demand on carriers in the Pacific also increased and the freight rate of West America to Tianjin route increased about 0.5%.
TBMI increased with shocks. It ended at 1027.87 points with an increase of 35.14 points (3.54%) from Feb.9 (the last release day of week 6). For the iron ore market, Australian miners were active and they chartered the carriers frequently before the holiday, which led the freight rate to increase with shocks. The freight rate of West Australia to North China increased about 5%. Available carriers in Atlantic were less and the freight rate of Brazil to Tianjin route increased over 2%. As for nickel ore, cargo volume of nickel ore was small and the freight rate of Surigao to Tianjin route was stable during the holiday and it increased over 0.3% within two weeks.
IV. Tianjin Domestic Container Freight Index (TDI)
Week 7-8, 2018 (Feb.11-Feb.24), the Tianjin Domestic Container Freight Index (TDI) released 7 times due to the Spring Festival and trend of is shown in the chart below:
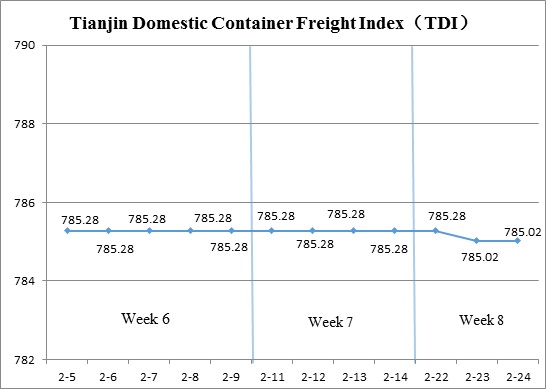
In Week 7-8, the TDI kept stable before the Spring Festival and then decreased slightly.
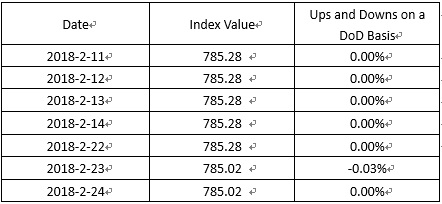
From Feb.11 to Feb.22, both the Inward and Outward indices kept stable. On Feb.23 (Fri.), the Inward Index decreased slightly and the TDI decreased slightly. On Feb.24 (Sat.), the TDI remained stable. Finally, the TDI ended at 785.02 points, with a decrease of 0.26 points (0.03%) from Feb. 9 (the last release day of Week 6).
The value of TDI ups and downs on a day-on-day basis are as follows:
Tianjin Domestic Container Outward Freight Index (TDOI) kept stable. The index closed at 968.65 points on Feb.24, which was the same with Feb.9 (the last release day of Week 6). During the Spring Festival the factories and dealers and transportation companies were on vacation and the demand of market dropped sharply. The deal was little and the outward freight rate kept the same with Week 6. The freight rates in Tianjin to Quanzhou/Guangzhou/Shanghai routes kept stable.
Tianjin Domestic Container Inward Freight Index(TDII)kept stable before the vacation and then decreased slightly. The index closed at 601.38 points on Feb. 24, down by 0.53 points or 0.09% from Feb. 9 (the last release day of Week 6). Due to the Spring Festival, the deal of market was depressed, and the freight rate kept stable. The rate in Quanzhou/Guangzhou to Tianjin routes kept stable in two weeks. Some shipping companies lower the freight rate in Shanghai-Tianjin route which led the index decreased 0.55% in two weeks.
HEADLINES
- Do shipping markets want Biden or Trump for the win?
- All 18 crew safe after fire on Japanese-owned tanker off Singapore
- Singapore launching $44m co-investment initiative for maritime tech start-ups
- Cosco debuts Global Shipping Industry Chain Cooperation Initiative
- US warns of more shipping sanctions
- China continues seaport consolidation as Dalian offer goes unconditional