Tianjin Shipping Index (Mar.12-Mar.16)
I. Tianjin Shipping Index (TSI)
In Week 11, 2018 (Mar.12-Mar.16), Tianjin Container Freight Index (TCI) kept decreasing. Tianjin Bulk Freight Index (TBI) hit a high point and then decreased. Tianjin Domestic Container Freight Index (TDI) increased steadily. Tianjin Shipping Index (TSI) decreased overall. The TSI closed at 583.46 points with a decrease of 1.26% from Mar.9 (the last release day of Week 10). The TSI trend is as follows,
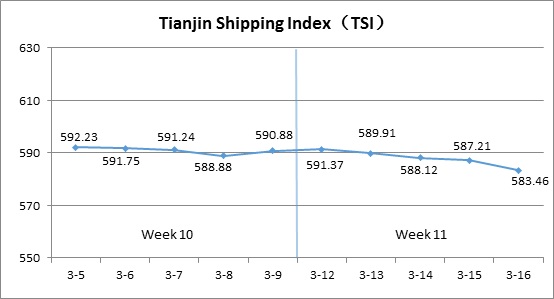
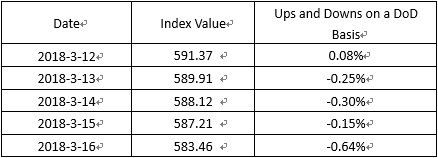
The chart above shows the trends of TSI from Mar.5 to Mar.16. The value of TSI in Week 11, 2018 is as follows,
II. Tianjin Container Freight Index (TCI)
In Week 11, 2018 (Mar.12 to Mar.16), the trend of TCI is as follows,
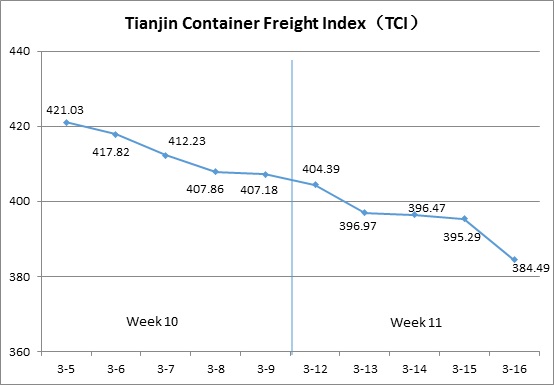
In week 11, the TCI kept decreasing.
From Mar.12 to Mar.13 (Mon. to Tue.), the freight rates in European route, Mediterranean route, North American route, South American West Coast route, Central South American route and India-Pakistan route decreased overall. The freight rates in South American East Coast route decreased after hitting a high point. The TCI kept decreasing by 2.51% on two consecutive release days. From Mar. 14 to Mar. 16 (Wed. to Fri.), the freight rates in European route, Mediterranean route, North American route, South American route and India-Pakistan route kept the decrease trend. The TCI kept decreasing by 3.14% on three consecutive release days.
The TCI closed at 384.49 points with a decrease of 22.69 points (5.57%) from Mar.9 (the last release day of Week 10).
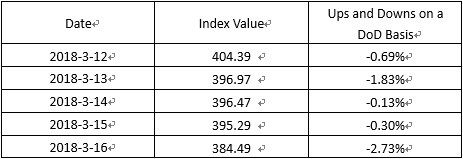
The TCI index value saw several up and down on a day-on-day basis are as follows:
European/Mediterranean route Cargo volume recovered slowly and transport capacity recovered overall. More ships will be put on the market at the end of the month, which will lead to the decrease of freight rates. The freight indices in European route, Mediterranean East route, Mediterranean West route decreased 9.15%, 9.06% and 7.83% respectively this week.
North American route The production and operation of factories returned to normal. Cargo volume increased in comparison with that of last week. But cargo volume was still under a low level and it was the mainstream to reduce the freight rates on the market. In North American West Coast route and North American East Coast route, the freight indices decreased 4.66% and 5.90% respectively this week.
South American route Although some shipping alliances kept their measures to cut the transport capacity, the competition for cargo was still fierce on the market. Ship owners reduced the freight rates to guarantee loading rate. The freight indices in South American West Coast route and Central South American route decreased 6.86% and 13.15% respectively this week. In South American East Coast route, the freight rates were tentatively raised early last week without concentrated efforts. Then, the freight rates kept decreasing and the freight indices decreased 4.75% this week.
India-Pakistan route Transport capacity was large but the increase of cargo volume failed to meet expectations. The center of freight rates kept decreasing. The freight indices decreased 9.05% this week.
III. Tianjin Bulk Freight Index (TBI)
Week 11, 2018 (Mar.12 – Mar.16), Tianjin Bulk Freight Index (TBI) is shown as follows:
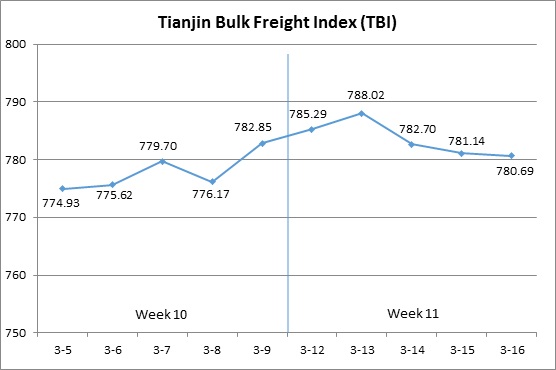
In week 11, the TBI first increased and then decreased.
From Mar.12 to Mar.13 (Mon. to Tue.), the freight rate of mineral ore decreased slightly and the freight rates of coal and grain continued to increase, which led the TBI to increase continuously. The total increase was 0.66%. From Mar.14 to Mar.15 (Wed. to Thu.), the freight rate of grain increased slightly and the freight rate of coal and mineral ore decreased, which led the TBI to decrease 0.87% for two successive release days.
On Mar.16 (Fri.), the freight rates of coal and grain kept stable and the decrease of mineral ore narrowed. TBI ended at 780.69 points with a decrease of 2.16 points (0.28%) from Mar.9 (the last release day of week 10).
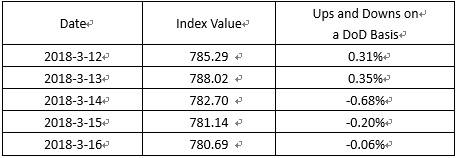
TBI index value saw several ups and downs on a day-on-day basis, which is shown as follows:
TBCI kept increasing earlier this week but decreased with shocks later. TBCI ended at 668.69 points with an increase of 18.93 points (2.91%) from Mar.9 (the last release day of week 10). For the Panamax market, the freight rate of the DBCT to Tianjin route kept increasing and the total increase was about 4.5%. For the Capesize market, the freight rate of Hay Point to Qingdao route first increased and then decreased. It increased about 0.5% this week.
TBGI increased continuously this week. It ended at 705.43 points with an increase of 4.38 points (0.62%) from Mar.9 (the last release day of week 10). The deal of grain was not very active. But as the freight rate of the Panamax increased continuously as a whole, the freight rate of grain increased slightly. The freight rate of South America to Tianjin route increased over 0.6%. The freight rate of US Gulf to Tianjin route increased about 0.5% and the freight rate of West America to Tianjin route increased 1.30%.
TBMI decreased continuously this week. It ended at 967.94 points with a decrease of 29.79 points (2.99%) from Mar.9 (the last release day of week 10). For the iron ore market, iron ore inventories in domestic ports were high and import demand was restrained, then the freight rate decreased continuously. The freight rate of West Australia to North China decreased about 4.5% and the freight rate of Brazil to Tianjin route decreased over 3.5%. As for nickel ore, the deal of nickel ore was active and it led the freight rate of Surigao to Tianjin route increased with shocks. The total increase this week was about 3%.
IV. Tianjin Domestic Container Freight Index (TDI)
Week 11, 2018 (Mar.12-Mar.16), the trend of Tianjin Domestic Container Freight Index (TDI) is shown in the chart below:
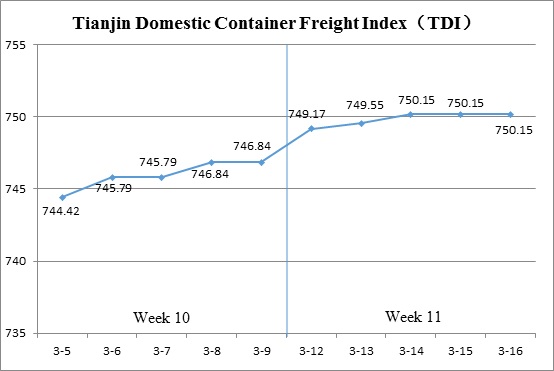
Compared with the TDI in Week 10, the TDI in Week 11 first increased and then kept stable.
In Week 11, the Outward Index remained the same, so the TDI was mainly influenced by the Inward Index. From Mar.12 (Mon.) to Mar.14 (Wed.), though the freight rate index of Guangzhou-Tianjin route suffered a slight decline, the freight rate index of Shanghai-Tianjin route went up, which finally got the TDI increased 0.44%. From Mar.15 (Thur.) to Mar.16 (Fri.), the Inward Index kept steady and the TDI was closed at 750.15 points, with a growth of 3.31 points (0.44%), compared with that on Mar.09 (the last release day of Week 10).
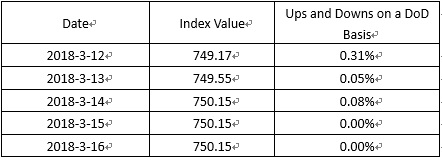
The value of TDI ups and downs on a day-on-day basis is shown as follows:
Tianjin Domestic Container Outward Freight Index (TDOI) remained stable this week and was closed at 873.49 points on Mar.16 (Fri.), the same with that on Mar.09 (the last release day of Week 10). That is to say, the demand and supply was relatively balanced this week, so the shipowners had to wait and see, further bringing steady freight rate index. On the weekend, the freight rate indices of three routes were flat on a week-on-week basis.
Tianjin Domestic Container Inward Freight Index (TDII) increased slowly at first and then kept stable this week, eventually being closed at 626.80 points on Mar.16, with an increase of 6.61 points (1.07%), compared with that on Mar.09 (the last release day of Week 10). This week, the trends of the freight rate index of the three routes were totally different. The freight rate index of Quanzhou-Tianjin route did not change any more after experiencing large growth last week. The freight rate index of Guangzhou-Tianjin route rose slightly (1.71%). However, the freight rate index of Shanghai-Tianjin route suffered a decline of 0.27%.
HEADLINES
- Dual-Fuel Fleet Surges to 400 Ships as Alternative-Fuel Investment Defies Market Slowdown
- Do shipping markets want Biden or Trump for the win?
- All 18 crew safe after fire on Japanese-owned tanker off Singapore
- Singapore launching $44m co-investment initiative for maritime tech start-ups
- Cosco debuts Global Shipping Industry Chain Cooperation Initiative
- US warns of more shipping sanctions