Tianjin Shipping Index (May 14-May 18)
I. Tianjin Shipping Index (TSI)
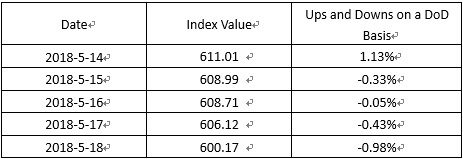
In Week 20 2018 (May 14-May 18), Tianjin Container Freight Index (TCI) decreased with shocks. Tianjin Bulk Freight Index (TBI) hit a high point and then decreased. Tianjin Domestic Container Freight Index (TDI) fluctuated with a narrow range. Tianjin Shipping Index (TSI) increased and then decreased. The TSI closed at 600.17 points with a decrease of 0.66% from May 11 (the last release day of Week 19). The TSI trend is as follows:
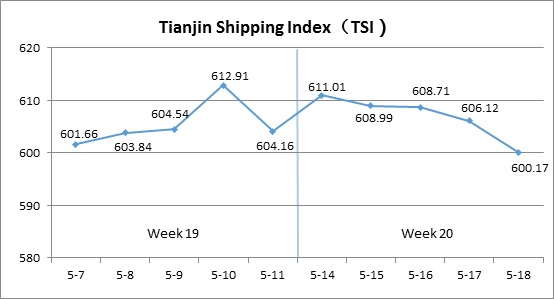
The chart above shows the trends of TSI from May 7 to May 18. The value of TSI in Week 20, 2018 is as follows:
II. Tianjin Container Freight Index (TCI)
In Week 20 2018 (May 14 to May 18),the trend of TCI is as follows:
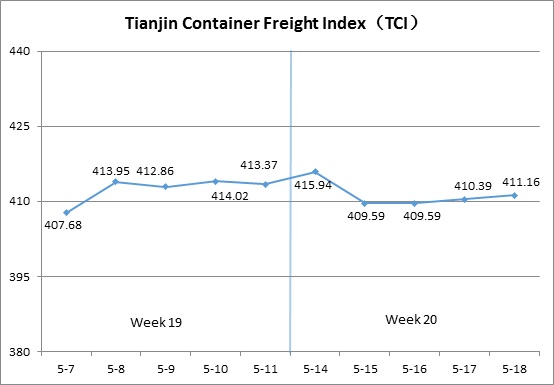
In week 20, the TCI decreased with shocks.
From May 14 to May 15(Mon. to Tue.), the freight rates in European Route, Mediterranean Route, North American Route ,South American West Coast Route and Central South American Route decreased overall. The freight rates in South American East Coast Route and Persian Gulf Route kept increasing. The TCI increased and then decreased. The decrease was 0.91% on two consecutive release days. From May 16 to May 18( Wed. to Fri.),The freight rates in European Route and Mediterranean Route increased slightly. The freight rates in South American Route decreased. The freight rates in North American Route and Persian Gulf Route kept stable.The TCI increased slightly by 0.38% on three consecutive release days.
The TCI closed at 411.16 points with a decrease of 2.21 points (0.53%) from May 11 (the last release day of Week 19).
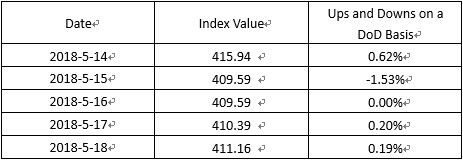
The TCI index value saw several up and down on a day-on-day basis are as follows:
European/Mediterranean route Since the end of April, the freight-rate-rising plan was carried out,which led to the rapid increase of freight rate. This week, the factories and traders slowed down the shipment pace. The cargo volume decreased.In first half of the week, the freight rates decreased markedly. In later half of the week, the ship owners continued to raise the freight rate. The freight rates in European Route, Mediterranean East Route and Mediterranean West Route decreased 6.75%, 1.31% and 1.38% on a week on week basis.
North American route Since Mid April, influenced by China-US trade friction and port congestion in the U.S., the freight rates increased for nearly four percent. Recently, the cargo owners’ willingness to carry cargo with high price were not strong, therefore, the freight rates presented a decrease trend the whole week. The freight rate in North American West Coast Route and North American East Coast Route decreased 4.29% and 3.34% this week.
South American route Freight transportation demand presented a weak trend. Some ship owners strengthened the efforts to collect cargo and reduced the GRI greatly. The freight rates in South American West Coast Route and Central South American Route decreased rapidly. The freight indices decreased 22.55% and 15.12% on a week on week basis. In comparison, the freight rates in South American East Coast Route increased and then decreased. The freight indices decreased slightly by 0.49% this week.
Persian-Gulf route On May 16, the Ramadan began. In the first two release days, the freight rates increased markedly and then stabilized. The freight indices increased 9.50% on a week on week basis.
III. Tianjin Bulk Freight Index (TBI)
Week 20, 2018 (May.14 – May.18), Tianjin Bulk Freight Index (TBI) is shown as follows:
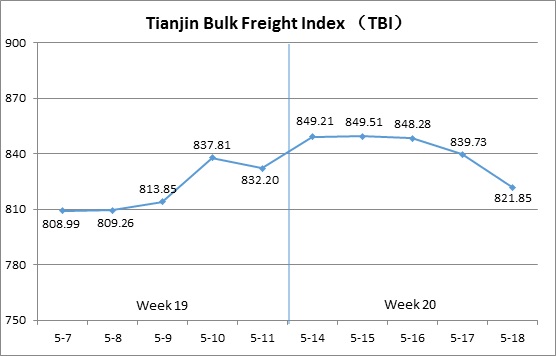
In week 20, the TBI increased earlier this week but decreased fast later.
From May.14 to May.15 (Mon. to Tue.), the freight rates of coal and grain increased slightly and the freight rate of mineral ore continued to increase, which led the TBI to increase further. Then, the freight rates of coal and grain became loose and the freight rate of mineral ore decreased and the decrease extended gradually. TBI decreased continuously from May.16 to May.18 (Wed. to Fri.) and the total decrease was 3.26%.
TBI ended at 821.85 points with a decrease of 10.35 (1.24%) from May.11 (the last release day of week 19).
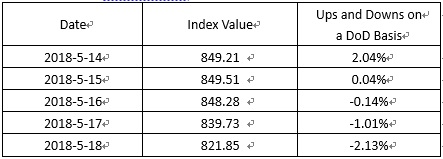
TBI index value saw several ups and downs on a day-on-day basis, which is shown as follows:
TBCI first increased and then decreased this week. TBCI ended at 629.72 points with a decrease of 0.66 points (0.10%) from May.11 (the last release day of week 19). Coal shipping market was stable this week and the trends of the freight rates of different shipping market were mixed. For the Panamax market, the freight rate of the DBCT to Tianjin route increased over 2.5%. For the Capesize market, under the influence of the decrease of the freight rate later in the week, the freight rate of Hay Point to Qingdao route decreased over 3.5% this week.
TBGI shocked narrowly this week. It ended at 687.95 points with an increase of 0.10 points (0.01%) from May.11 (the last release day of week 19). The market in the Atlantic continued to be weak and freight rate changed slightly. The freight rate of South America to Tianjin route and the freight rate of US Gulf to Tianjin route were almost the same with that in last week. By contrast, the Pacific market stabilized and increased and the freight rate of West America to Tianjin route continued to increase and the total increase was over 0.3%.
TBMI continued to increase earlier this week but decreased fast later. It ended at 1147.87 points with a decrease of 30.49 points (2.59%) from May.11 (the last release day of week 19). For the iron ore market, both deals and inquiries of Australian miners increased and the freight rate of West Australia to North China stayed at a high level and the freight rate of Brazil to Tianjin route also increased. In the second half of the week, under the influence of the decrease of the FFA contract price, the freight rate of Capesize decreased. The freight rate of West Australia to North China route decreased over 3.5% and the freight rate of Brazil to Tianjin route decreased over 1.2%. As for nickel ore, the freight rate of Surigao to Tianjin route increased slightly and the total increase was 0.31%.
IV. Tianjin Domestic Container Freight Index (TDI)
Week 20 2018 (May.14-May.18), the trend of Tianjin Domestic Container Freight Index (TDI) is shown in the chart below:
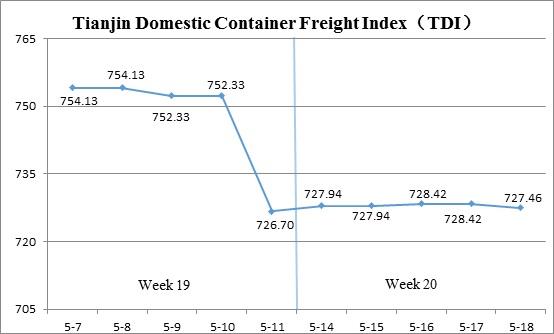
The TDI in Week 20 fluctuated slightly.
The Outward Index kept steady this week, and the TDI fluctuated with the Inward Index, more specifically, with the freight of Guangzhou-Tianjin route. On Monday and Wednesday, it went up, which drove the TDI also rising slightly. On May 18 (Fri.), it decreased a bit, so the TDI ended at 727.46 points, 0.76 points (0.10%) more than that on May.11 (the last release day of Week 19).
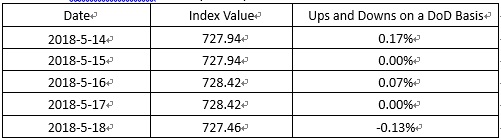
The value of TDI ups and downs on a day-on-day basis is shown as follows:
Tianjin Domestic Container Outward Freight Index (TDOI) returned to stability this week and eventually ended at 852.51 points on May.18, the same with the index on May.11 (the last release day of Week 19). In details, the freight indices of three routes, including Tianjin-Quanzhou, Tianjin-Shanghai and Tianjin-Guanghzou, all remained stable week on week. This is because the freight of the southbound routes leveled off this week after suffering plummet for nearly one month and the ship owners were in wait and see mode.
Tianjin Domestic Container Inward Freight Index (TDII) experienced a slight rise this week and finally closed at 602.40 points on May.18, increasing 1.51 points (0.25%) compared with that on May.11 (the last release day of Week 19). Specifically, the freight of Quanzhou-Tianjin and Shanghai-Tianjin in the northern route market kept steady this week. By contrast, that of Guangzhou-Tianjin route, was continued to be pushed slowly by the ship owners and eventually increased 0.37% week on week, though once declined slightly.
HEADLINES
- Reversal! HMM Union Drops Opposition, Headquarters Relocation to Busan Confirmed
- Five Major Shipping Lines Have Over 30 Vessels Trapped in the Strait of Hormuz
- COSCO SHIPPING Holdings Achieves RMB 5.877 Billion in Net Profit Attributable to Parent Company in Q1 2026
- VLCC Idle Rate Climbs to 55%! Tanker Owners Grapple with Scarcity of Physical Cargoes
- COSCO SHIPPING Energy: Acquires 100% Equity of Dalian Investment; Q1 Net Profit Soars by 206.7%
- China's largest domestically built LNG carrier delivered