Tianjin Shipping Index (Jan.2 to Jan.4)
I. Tianjin Shipping Index (TSI)
In Week 1, 2019 (Jan.2 to Jan.4), Tianjin Shipping Index (TSI) was released three times because of the New Year Holidays. Tianjin Container Freight Index (TCI) increased rapidly. Tianjin Bulk Freight Index (TBI) stopped decreasing and increased. Tianjin Domestic Container Freight Index (TDI) decreased. Tianjin Shipping Index (TSI) increased slowly. The TSI closed at 662.92 points with an increase of 1.41% from Dec.21 (the last release day of Week 51). The TSI trend is as follows:
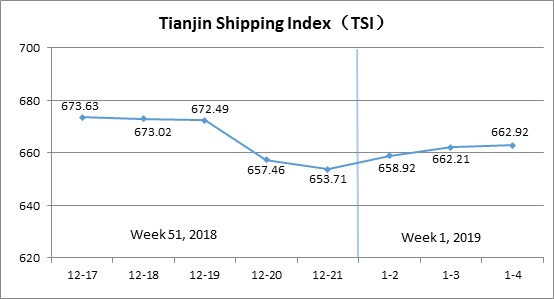
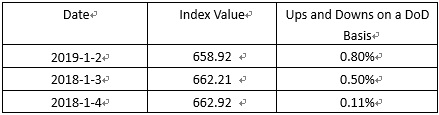
The chart above shows the trends of TSI from Dec.17, 2018 to Jan.4, 2019. The value of TSI in Week 1, 2019 is as follows:
II. Tianjin Container Freight Index (TCI)
In Week 1, 2019 (Jan.2 to Jan.4), the Tianjin Container Freight Index (TCI) was released three times because of the New Year Holidays. The trend of TCI is as follows:
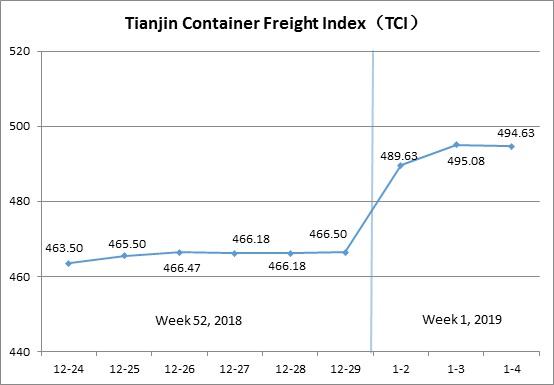
In week 1, the TCI increased rapidly.
From Jan.2 to Jan.3 (Wed. to Thur.), the freight rates in European route, Mediterranean route, American route, South American route and Persian Gulf route increased. The TCI increased 6.13% on two release days. On Jan.4 (Fri.), the freight rates in each route kept steady. The TCI decreased 0.09% on a single day.
The TCI closed at 494.63 points with an increase of 28.13 points (6.03%) from Dec.29 (the last release day of Week 52).
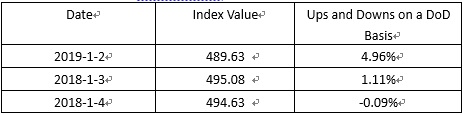
The TCI index value and several ups and downs on a day-on-day basis are as follows:
European/Mediterranean route Driven by the Spring Festival holiday, traders accelerated the pace of shipments and strived to complete the stocking and shipment before the factory holiday. The market shipping volume continued to rise, and the shipping alliances increased their freight rates. The freight rate rose rapidly this week. The freight indices in European route, Mediterranean East route and Mediterranean West route increased 9.02%, 9.17% and 3.65% on a week-on-week basis.
American route The shipping company optimized the layout of the liner voyage with the adjustment of the market’s shipment volume, so the overall capacity was reduced. Entering the new year, the market supply and demand relationship tended to be balanced. Driven by the Spring Festival holiday, the shipping companies followed the market pace to increase the freight rates as a whole. The freight indices in American West Coast route and American East Coast route decreased 8.12% and 3.94% on a week-on-week basis.
South American route The freight rate was generally up. As for South American West Coast route and Central South American Coast route, some of the ship owners took the lead in the price increase, so this week it continued the last week’s gains. However, due to the slow growth of demand, the trend slowed down significantly. The freight indices increased 0.66% and 0.40% on a week-on-week basis. In contrast, the freight rate of the South American East Coast route continued to fall in the early period. After the New Year’s Day, the market consensus was reached and the freight rate rose sharply. The freight index increased 28.72% on a week-on-week basis.
Persian-Gulf route The market shipping volume increased steadily, and the freight rate continued to increase. The freight index increased 10.90% on a week-on-week basis.
III. Tianjin Bulk Freight Index (TBI)
Week 1, 2019 (Jan.2-Jan.4), Tianjin Bulk Freight Index (TBI) was released three times in the week due to New Year’s Day holiday arrangements, and the trend is shown as follows:
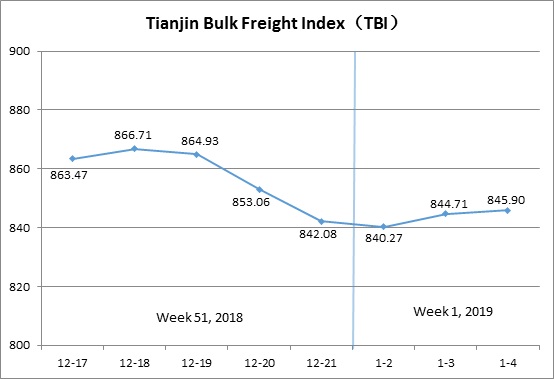
In week 1, the TBI rose slightly.
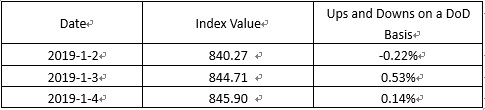
On Jan.2 (Wed.), the freight rates of coal and mineral ore were basically flat compared with the pre-holiday, while the freight rate of grain saw a slight decline compared with the pre-holiday, and the TBI fell slightly by 0.22%. Subsequently, the freight rates of coal and grain shocked narrowly, and that of mineral ore rebounded to a certain extent, driving TBI to rise continuously from Jan.3 to Jan.4 (Thur. to Fri.).
Finally, the TBI closed at 845.90 points, up 3.82 points, or 0.45% from Dec.21 (the last release day of week 51, 2018).
The TBI index value and several ups and downs on a day-on-day basis are as follows:
TBCI shook narrowly in the week, and the index value closed at 641.44 points, down 0.22 points, or 0.03%, from Dec.21 (the last release day of week 51, 2018). For the Panamax, the holiday atmosphere in the market was strong, and both the ship and the cargo parties had obvious wait-and-see sentiment. The freight rate of DBCT to Tianjin route dropped by more than 1.5% compared with that before the holiday. In contrast, the freight rate of the Cape ship rebounded in the later of the week, and the freight rate of Hay Point to Qingdao route increased by more than 1.5% compared with the pre-holiday.
TBGI shocked down in the week, and the index value closed at 729.58 points, down 6.83 points, or 0.93%, from Dec.21 (the last release day of week 51, 2018). Soybeans in South America were shipped in succession, but empty capacity was still relatively large, coupled with the impact of falling oil prices, the overall grain market freight rate fell slightly. The freight rate of U.S. Gulf to Tianjin route dropped 0.07% in the week, South America to Tianjin route dropped more than 1.8% in the week, and West America to Tianjin route dropped nearly 1% in the week.
TBMI rose slightly in the week, and the index value finally closed at 1166.68 points, up 18.50 points, or 1.61%, from Dec.21 (the last release day of week 51, 2018). For the iron ore market, after the New Year's Day holiday, market transactions were more active, which led to a rebound in market freight rates, and the freight rate of West Australia to North China route rose by nearly 3% in the week. In contrast, the freight rate of Brazil to Tianjin route fell at the weekend due to the increase of empty capacity, and the freight rate fell more than 1.5% compared with the pre-holiday period. As for nickel ore, the freight rate of Surigao to Tianjin route remained basically stable in the week.
IV. Tianjin Domestic Container Freight Index (TDI)
The TDI has been issued three times because of New Year’s Day in week 1, 2019 (Jan.2-Jan.4). The trend of Tianjin Domestic Container Freight Index (TDI) in week 1, 2019 (Jan.2-Jan.4) is shown in the chart below.
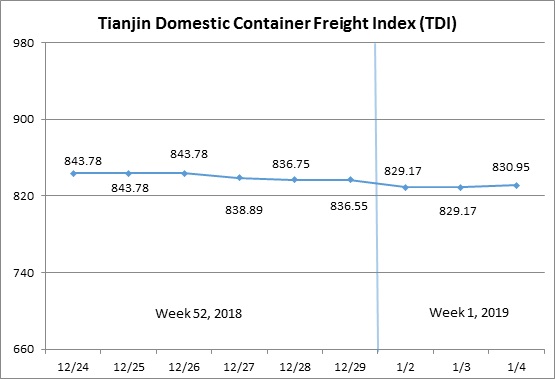
The TDI in week 1 showed a downtrend in fluctuation.
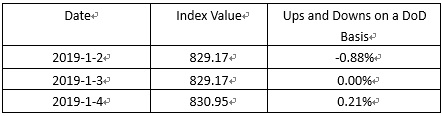
On Jan.2 (Wed.), the Outward Index remained the level before New Year’s Day, and the freight rate of Guangzhou-Tianjin route under Inward Index went downward, which drove TDI decrease significantly. From Jan.3 to Jan.4 (Thur.-Fri.), the Outward Index increased modestly, while the Inward Index kept steady. The TDI had a slight rise and finally closed at 830.95 points, 5.6 points (0.67%) lower than that on Dec.29 (the last release day of Week 52).
The TDI index value and several ups and downs on a day-on-day basis are as follows:
Tianjin Domestic Container Outward Freight Index (TDOI) rose slightly, and eventually ended at 866.60 points on Jan.4, 3.55 points (0.41%) higher than that on Dec.29 (the last release day of Week 52). The freight rate of this route fluctuated modestly because the market kept relatively stable after New Year’s Day. In this week, the freight rate of Tianjin-Shanghai route had a small drop, and the index of this route decreased by 1.52% compared with last week. By contrast, the freight rate of Tianjin-Guangzhou route showed a trend of slight increase, thus the index rose by 0.77% compared with last week. In addition, the freight rate of Tianjin-Quanzhou route kept steady in this week, and no obvious fluctuation of index was observed.
Tianjin Domestic Container Inward Freight Index (TDII) went downward and finally closed at 795.29 points on Jan.4, 14.75 points (1.82%) lower than that on Dec.29 (the last release day of Week 52). The freight rates of Quanzhou-Tianjin route and Shanghai-Tianjin route kept stable in this week, and the indices of those two routes remained flat compared with last week. While the freight rate of Guangzhou-Tianjin route decreased apparently and the index dropped by 2.58% compared with last week.
HEADLINES
- Reversal! HMM Union Drops Opposition, Headquarters Relocation to Busan Confirmed
- Five Major Shipping Lines Have Over 30 Vessels Trapped in the Strait of Hormuz
- COSCO SHIPPING Holdings Achieves RMB 5.877 Billion in Net Profit Attributable to Parent Company in Q1 2026
- VLCC Idle Rate Climbs to 55%! Tanker Owners Grapple with Scarcity of Physical Cargoes
- COSCO SHIPPING Energy: Acquires 100% Equity of Dalian Investment; Q1 Net Profit Soars by 206.7%
- China's largest domestically built LNG carrier delivered