Dry Bulk Market: Demand Ramping Up Bodes Well for Shipping
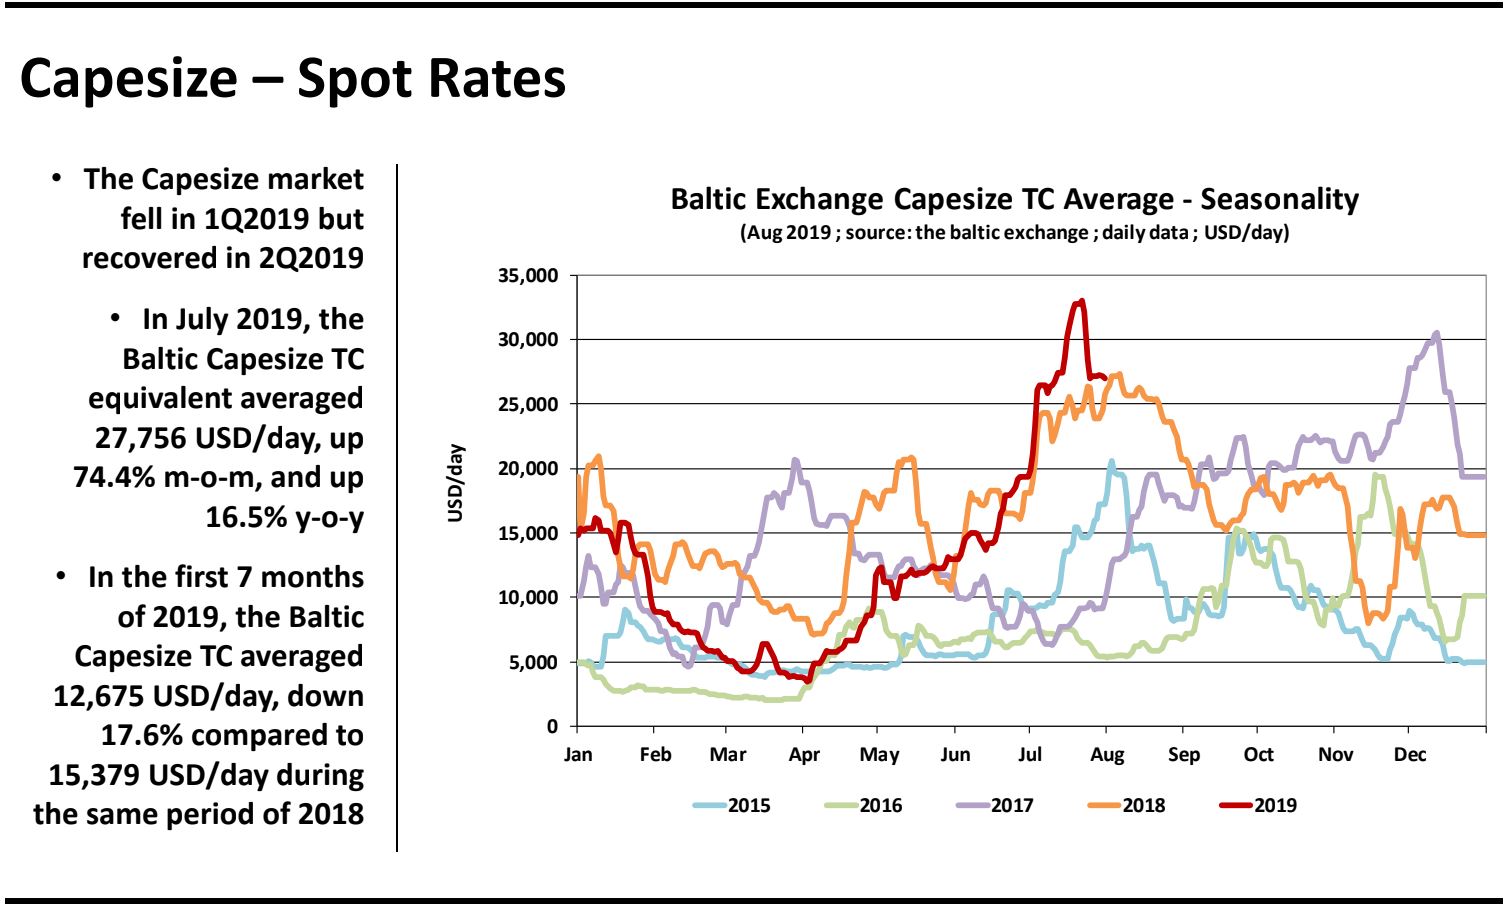
The dry bulk market is entering the final period of 2019 on a high note. It’s quite the constrast compared to the early part of the year. In a recent analysis, shipbroker Banchero Costa noted that “in the first 7 months of 2019, the Baltic Capesize, Panamax, Supramax and Handysize TC indices averaged respectively 12,675 USD/day, 9,340 USD/day, 8,559 USD /day and 6,206 USD/day, decreasing respectively by ‐17.6%, ‐16.3%, ‐23.1% and ‐27.7% y‐o‐y from Jan‐Jul 2018”.
In terms of vessel activity, the shipbroker said that “benchmark newbuilding prices in July 2019 were estimated at about 50.5 mln USD for a Capesize, about 29.5 mln USD for a Panamax, about 27.0 mln USD for a Supramax, and about 24.0 mln USD for a Handy. Indicative 5‐year old secondhand prices in July 2019 were estimated at about about 35.5 mln USD for a Capesize, about 23.6 mln USD for a Panamax, about 17.4 mln USD for a Supramax, and about 16.8 mln USD for a Handy. Indicative 1‐year timecharter rates in July 2019 were estimated at about about 20,500 USD/day for a Capesize, about 13,900 USD/day for a Panamax, about 10,900 USD/day for a Supramax, and about 8,900 USD/day for a Handy. Newbuilding deliveries of dry bulk vessels of over 20,000 DWT are expected to increase in 2019 to around 37.0 mln DWT, from a low of just 27.4 mln DWT in 2018. In the first 7 months of 2019, we recorded the delivery of 227 units over 20,000 DWT, for a total of 21.8 mln DWT, up 23% on the same period last year”.

Source: Banchero Costa
Meanwhile, “demolition activity in 2019 is expected to increase to about 10.0 mln DWT, from a low of just 4.0 mln DWT in 2018, due to more modest market expectations this year, and the impact from the implementation of the ballast water and sulphur regulations. In the first 7 months of 2019, we recorded the demolition of 34 units over 20,000 DWT, for a total of 4.9 mln DWT, up 80% on the same period last year in dwt terms. We estimate net fleet growth to remain flat at about +3% y‐o‐y in 2019, similar to the growth in 2018. Contracting activity has been modest so far this year. In the first 7 months of 2019, 78 units over 20,000 DWT were contracted, for a total of 7.5 mln DWT (excluding back‐dated Tier 2 contracts). This is ‐41% down from the 132 units, or 13.9 mln DWT, in the same period last year”.
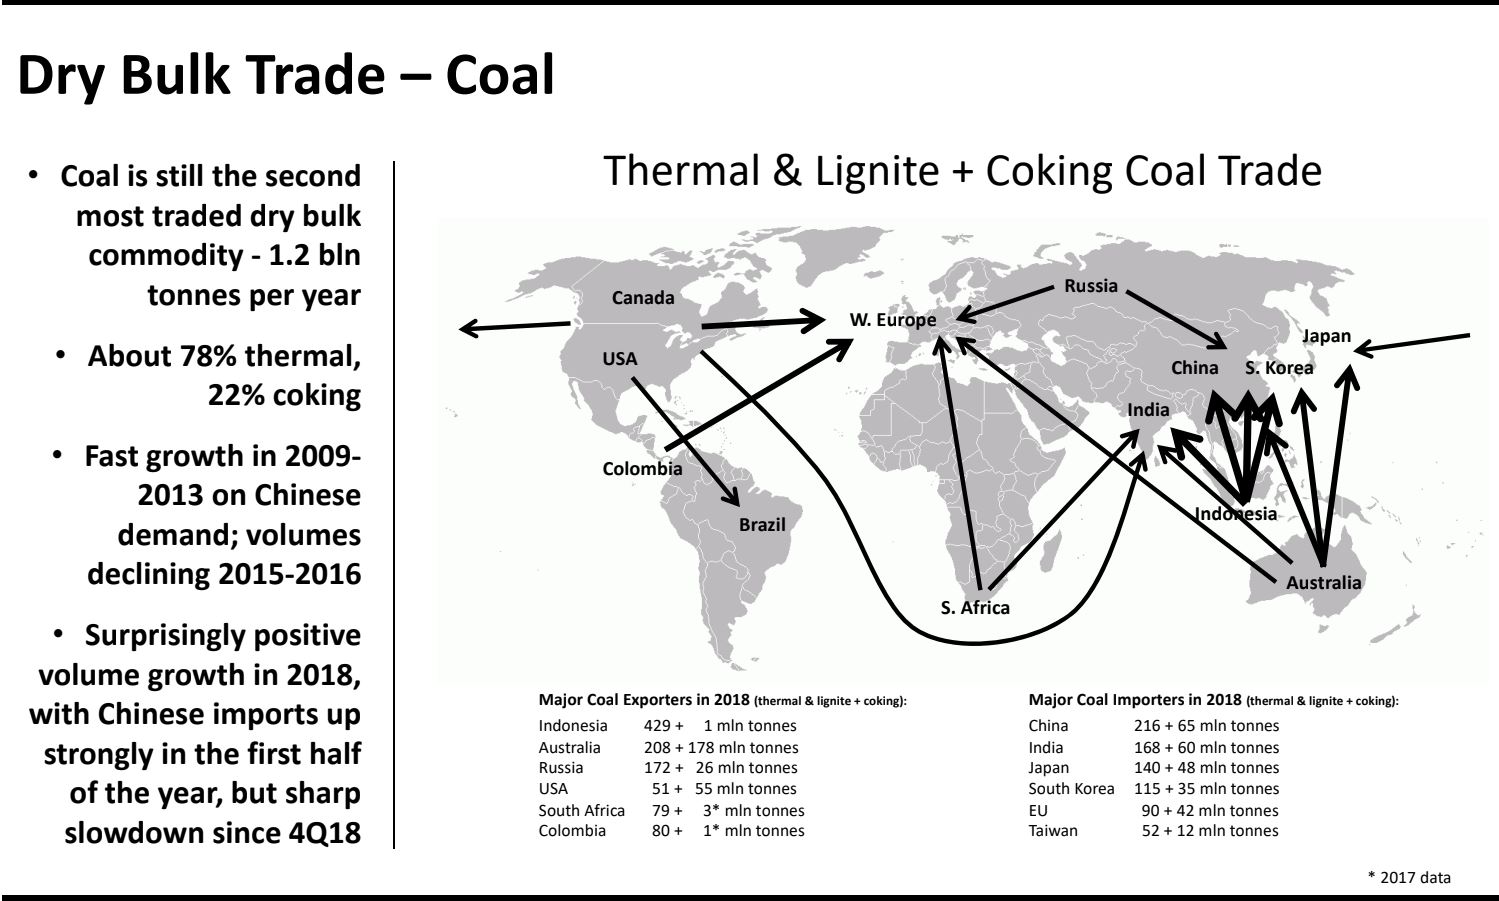
Demand-wise, Banchero Costa said that “Chinese imports of coking coal increased by a massive 25 percent y-o-y to 36.3 mln tonnes in the first half of 2019, reversing the decline seen last year and even exceeding the record volumes of 2017. Volumes were particularly high in January 2019, at 7.4 mln tonnes, from just 3.1 mln tonnes in December 2018, because of delays in Customs clearing caused by last year’s quotas. Nevertheless, imports have been higher on an y-o-y basis in every month except May. Steam coal and lignite imports also increase this year, but by a more modest 1.4 percent year-on-year to 118.2 mln tonnes. This was the highest volume for this time of the year since 2014. Here again, volumes were particularly high in January 2019, at 26.1 mln tonnes, from just 7.1 mln tonnes in December 2018, because of delays in Customs clearing. Steam coal imports then remained relatively modest over February and March, before sharply increasing in May and June”.
Source: Banchero Costa
The shipbroker added that “vessel tracking indicates that imports in July could have been higher still. Indonesia has been the main beneficiary in this year’s increase in demand for coal. In the first 6 months of 2019, China imported 67.9 mln tonnes of coal from the South-East Asian nation, up 10.5 percent from the 61.4 mln tonnes in the same period last year, according to Refinitiv shiptracking data. Imports from Australia have also increased, despite the widely reported Customs clearance difficulties and port restrictions at the start of the year. Australia exported 43.8 mln tonnes of coal to China in January-June 2019, up 6.2 percent year-on-year. Politics, however, most likely played a role in restricting shipments from the USA and Canada.
Source: Banchero Costa
US coal shipments to China were down by more than half in the first 6 months of 2019 at 1.0 mln tonnes, down from 2.1 mln tonnes in thre same period last year. Imports from Canada also crashed by 19.2 percent year-on-year to 1.0 mln tonnes, from 1.3 mln tonnes in the same period last year. Elsewhere, volumes from Russia have continued to grow as more export capacity has become available, especially on small vessels from Russia’s Far East ports – total seaborne volumes to China increased by 25.4 percent year-on-year to 12.9 mln tonnes. Exports from Ukraine to China also surged, by a massive 169 percent, to 2.4 mln tonnes in the first half of 2019. Finally, coal volumes from Mozambique to China continue to grow, by 12.1 percent in 1H2019 to 2.0 mln tonnes, whilst shipments from South Africa decreased by 19.2 percent to just 1.0 mln tonnes. About 18 mln tonnes of coal were imported by land in 1H2019, largely coking coal from Mongolia, down from about 20 mln tonnes in the same period last year. An increasing shift towards Indonesian and Russian supply, and away from Australia, naturally favours the use of smaller vessels for transportation. In the first 6 months of 2019, only 27 mln tonnes of China’s total 136.5 mln tonnes of seaborne coal imports were carried on Capesize (120+ dwt) vessels, whilst 40 mln tonnes were carried on Panamaxes (65-85k dwt), 57 mln tonnes on Supramaxes (40-65k dwt), and 8 mln tonnes on Handies (20-40k dwt)”, the shipbroker concluded.
HEADLINES
- Reversal! HMM Union Drops Opposition, Headquarters Relocation to Busan Confirmed
- Five Major Shipping Lines Have Over 30 Vessels Trapped in the Strait of Hormuz
- COSCO SHIPPING Holdings Achieves RMB 5.877 Billion in Net Profit Attributable to Parent Company in Q1 2026
- VLCC Idle Rate Climbs to 55%! Tanker Owners Grapple with Scarcity of Physical Cargoes
- COSCO SHIPPING Energy: Acquires 100% Equity of Dalian Investment; Q1 Net Profit Soars by 206.7%
- China's largest domestically built LNG carrier delivered