Down The Orderbook Slope
The orderbook has fallen by 24.7% in terms of CGT during the year-to-date, and by 53.8% since the end of 2008. This month's Shipbuilding Focus investigates the impact of this decline, with many yards soon to complete the delivery of their orderbook.
The Orderbook Drop
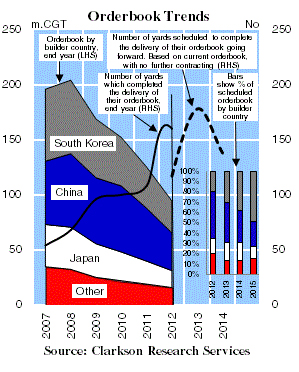
The Graph of the Month shows the size of the orderbook at the end of each year, and 2012 y-t-d. Since its peak in September 2008, the orderbook has declined by 56.1% to now stand at 94.3m CGT. The Japanese orderbook has fallen 60.1% during this period, with the Chinese and Korean orderbook falling by 48.7% and 56.6% respectively. This reduction has been influenced by a record period of output from 2010, coupled with reduced contracting levels since 2009. In 2010 deliveries increased by 16.5% y-o-y, to reach an annual record of 52.1m CGT, with a further 50.2m CGT entering service in 2011 and a projected 50.2m CGT in 2012. In contrast, total contracting since 2009 has declined by 57.0% compared to the four years previously.
Different Schedules
Yards in China currently have the largest orderbook, a position they have held since 2009, with 34.2m CGT on order. This is 15.2% more than the 29.0m CGT on order at Korean yards. However, as shown on the bar graph, Korean yards have a larger volume of vessels on order after 2013. Based on the current orderbook Korean yards have 25.0% more CGT on order than Chinese yards in 2014, and 107.0% more in 2015. Although ordering levels have fallen since 2011, Korean yards have taken 14.8% more CGT than yards in China in that period. This is mainly due to Korean yards securing the majority of the more complex vessel types that have been ordered. Of the 19.4m CGT ordered in Korea since 2011, 49.5% is scheduled for delivery after 2013.
Out of Order
The solid line on the graph shows the number of yards that completed the delivery of their orderbook in each year. The dotted line shows the number of yards, which according to scheduled delivery dates, are expected to complete the delivery of their orderbook going forward.
In 2011, 108 yards completed the delivery of their orderbook, double the number that did so in 2007, and in the y-t-d an additional 160 yards have delivered the final vessel they had on order. 117 yards are scheduled to finish the delivery of their orderbook by the end of 2012, whilst 178 yards have no vessels on order after 2013. With 31.5% of active shipyards based in China, it is perhaps unsurprising that 67.5% of yards which have completed the delivery of their orderbook in the y-t-d have been located there. Additionally, 30.8% of yards which are scheduled to deliver their orderbook by the end of 2013 are in China.
So, the orderbook has reduced considerably since its peak in 2008, declining by 53.8% in CGT terms, with output at record levels during the last three years whilst contracting activity has remained subdued. Based on the current orderbook, 23.6% of currently active yards worldwide will have no vessels on order by the end of 2012, whilst a further 36.0% have no orderbook after 2013. No wonder so many yards are hungry for new business!
Source: Clarkson Research Services
HEADLINES
- Do shipping markets want Biden or Trump for the win?
- All 18 crew safe after fire on Japanese-owned tanker off Singapore
- Singapore launching $44m co-investment initiative for maritime tech start-ups
- Cosco debuts Global Shipping Industry Chain Cooperation Initiative
- US warns of more shipping sanctions
- China continues seaport consolidation as Dalian offer goes unconditional