Supply/demand: Asia-Med
East Med comes to the rescue
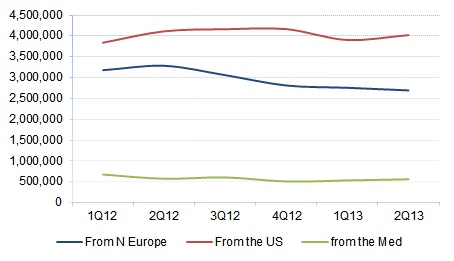
Cargo between Asia and the Eastern Mediterranean is beginning to climb again, compensating for poor cargo growth to/from the Western Mediterranean.
Westbound
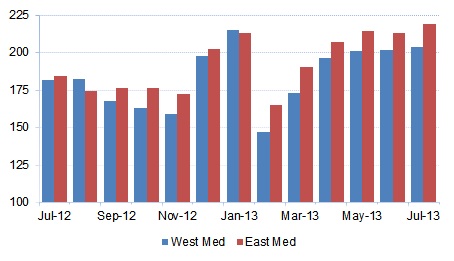
This year’s peak season from Asia to the Mediterranean continued badly in July, with only 422,000 teu being shipped, compared to 415,000 teu in both May and June. Mediterranean consumers and holiday makers clearly remained in no mood to splash out, which is unsurprising, given the chronic state of most European countries’ economies.
Much of the small peak season cargo increase was destined to Eastern Mediterranean countries, whose traffic grew by 3% up to 219,000 teu, making the region significantly larger than its Western counterpart, where France, Spain and Italy are either still in, or hovering close to recession.
This took the Eastern region’s traffic during the first seven months of the year up to 1,421,000 teu, representing a year-on-year increase of 10%, compared to the Western Mediterranean’s lacklustre 2%, up to 1,337,000 teu. Little wonder, therefore, that ocean carriers have been spending time developing new feeder services around the Eastern Mediterranean. The overall westbound cargo increase was 6%.
Figure 1
Westbound Asia-Mediterranean Container Traffic (’000 teu)
Source: Drewry Maritime Research, derived from CTS
The response of ocean carriers was to increase westbound vessel capacity by just 1% between June and July, up to 449,522 teu, and then by another 1% between July and August, largely through a reduction in the number of sailings cancelled. Vessel upgrades appear to have stopped, as the average size of all vessels deployed, including mother vessels used between Asia and Northern Europe, fell from 9,300 teu in June to 9,000 teu in August.
Compared to 11 sailing cancellations in June, only eight were omitted in July, including three from the G6’s ABX service to the Eastern Mediterranean/Black Sea, which is in the process of being withdrawn, to be replaced by a jointly run feeder service (BSF) starting on 1 October, and four from CSCL/K Line/Yang Ming/PIL/Wan Hai/Cosco/Sim/Hanjin’s jointly run ABX/CBX/ABS service, also to the Eastern Mediterranean/Black Sea.
Figure 2
Westbound Asia to Mediterranean Capacity (’000 teu)
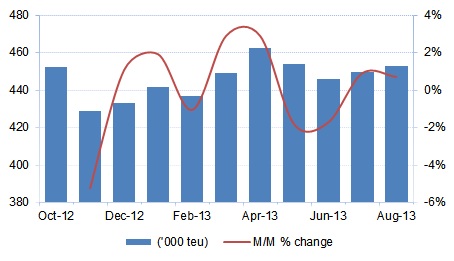
Source: Drewry Maritime Research
This was followed by another 8 sailing cancellations in August, including four from the G6’s ABX service and four from the ABX/CBX/ABS schedule. As this is the third month of sailing omissions from the ABX/CBX/ABS schedule, it seems that the service is also being withdrawn – presumably also in disgust at the poor freight rates required to compete in the Black Sea.
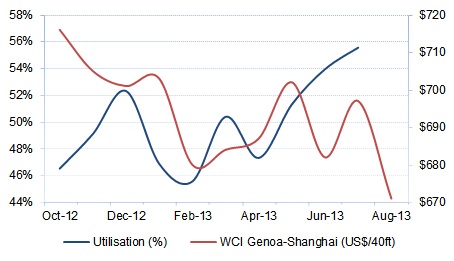
The consequence is that the average utilisation of all vessels sailing from Asia to the Mediterranean remained at a healthy 93%, which helped ocean carriers increase freight rates again on 1 July, as shown in Figure 3. Industry sources say that average vessel utilisation is now back below 90% again, which partly explains the downturn in rates at the beginning of September. For more details, see Pricing section.
Figure 3
Westbound Asia-Mediterranean Utilisation v Rates
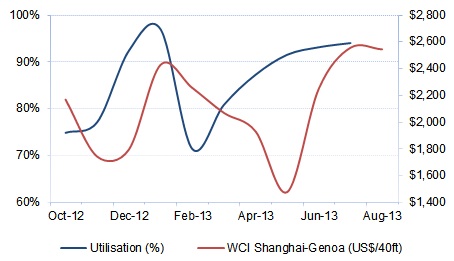
Sources: Drewry Maritime Research; World Container Index assessed by Drewry
Containerised cargo shipped from the Mediterranean to Asia increased by 4% from June to July, up 186,000 teu, spread evenly between the Eastern and Western regions. This took the increase for the year up to a healthy 10.5%, largely due to Eastern Mediterranean cargo increasing by 14%, up to 600,000 teu, putting it just ahead of the Western Mediterranean’s 599,000 teu (+7%) for the first time.
Figure 4
Eastbound Asia-Mediterranean Container Traffic (’000 teu)
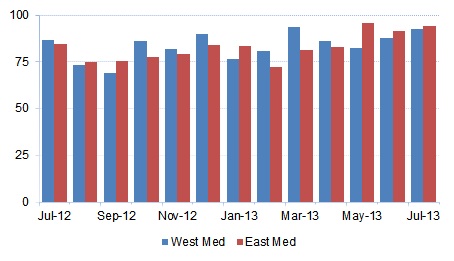
Source: Drewry Maritime Research, derived from CTS
This was much better than Northern Europe’s 2% decline, suggesting that suppliers in the Mediterranean were hungrier for business. As shown in Figure 4a, they hung onto their waste paper and scrap plastics traffic better, and housing market traffic, another big mover, also increased by 18% between 1Q 13 and 2Q 13, up to 75,333 tonnes according to Global Transport Information Services.
Figure 4a
China Imports of Waste Paper and Scrap Plastics (tonnes)
Source: Global Trade Information Services
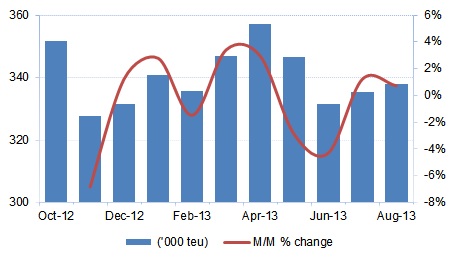
The consequence of the westbound schedule changes mentioned earlier is that the capacity of all vessels sailing from the Mediterranean to Asia also increased by 1% between June and July, up to 335,400 teu, and then by another 1% between July and August, up to 338,000 teu, as shown in Figure 5.
Figure 5
Eastbound Mediterranean to Asia Capacity (’000 teu)
 Source: Drewry Maritime Research
This meant that average eastbound vessel utilisation rose from a poor 51% in June to a less poor 55% in July, however this was not enough to stop ocean carriers fighting over market share through freight rate reductions, as shown in Figure 6. See Pricing section for more details.
Figure 6
Eastbound Asia-Mediterranean Utilisation v Rates
Sources: Drewry Maritime Research; World Container Index assessed by Drewry
Table 1
Asia-Mediterranean – Estimated Monthly Supply/Demand Position
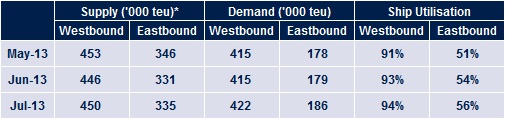
Notes: * After deduction of 20% eastbound and 8.5% westbound for unusable slots due to deadweight limitations and high-cube adjustment, plus further deduction for out-of scope cargoes 2.5% eastbound and 2.0% westbound
Source: Drewry Maritime Research
Our View
The rest of this year’s peak season is likely to remain a non-event, forcing ocean carriers to continue cancelling sailings to maintain freight rate levels.
HEADLINES
- Do shipping markets want Biden or Trump for the win?
- All 18 crew safe after fire on Japanese-owned tanker off Singapore
- Singapore launching $44m co-investment initiative for maritime tech start-ups
- Cosco debuts Global Shipping Industry Chain Cooperation Initiative
- US warns of more shipping sanctions
- China continues seaport consolidation as Dalian offer goes unconditional