The Shifting Patterns of Chinese Box Throughput
The rapid development of Chinese manufacturing over the last couple of decades drove the dramatic expansion of containerized exports, necessitating the swift development of Chinese container ports. By 2012, TEU lifts at Chinese mainland ports accounted for 30% of global lifts, more than double their share in 2001, when China entered the WTO. When throughput at the port of Hong Kong is included, the Chinese share of global lifts last year reached 33%.
The Leading Global Role
In 2012, box throughput at Chinese mainland ports reached 176.5m TEU, up from just 27.5m TEU in 2001. Including Hong Kong, there are now a total of 23 Chinese ports with annual container throughput of over a 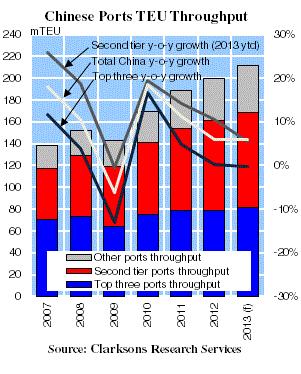 million TEU, bringing total lifts at Chinese ports to 199.6m TEU last year. As a result of this rapid expansion, there are now ten Chinese container ports in the global top 20, and 7 in the top ten in terms of box volumes. The port of Shanghai recorded 32.5m TEU lifts in 2012, confirming it as the world’s busiest container port.
Top Three Slowdown
The top three Chinese container ports, Shanghai, Hong Kong and Shenzhen, historically saw the fastest growth (combined throughput rose by 289% between 1997 and 2007)owing to their crucial role in “opening the door” for Chinese international trade. These three ports accounted for 64.5% of total Chinese TEU lifts in 2001, with Hong Kong alone contributing 39.3%.
However, as the Graph of the Month shows, the throughput growth rate of top three ports has consistently been slower than the total Chinese port growth rate in recent years. Indeed, Hong Kong saw throughput fall by 5.3% in 2012, while lifts were down 5.8% y-o-y over the first ten months of 2013. While labour unrest has contributed to the weak handling volumes this year, the broader cause of the decline is the strong competition from nearby ports in the Pearl River delta, as well as the gradual shift of manufacturing from the region towards inner provinces. Indeed Shenzhen has also seen lacklustre volume growth - just 0.5% y-o-y so far this year.
Second Tier Overtake
Ningbo, Qingdao, Tianjin, Xiamen, Guangzhou, Dalian, Yingkou and Lianyungang are the other ports in the Chinese mainland top 10, making up the ‘second tier’. They have experienced more rapid growth in recent years, with annual throughput expanding by an average of 14.7% in 2007-12 (compared to 4.1% for the top three). This port growth was driven by the proximity to centres of Chinese manufacturing growth such as the Yangtze River delta, and northern economic zones. In 2012, the second tier ports saw their combined annual throughput (83.1m TEU) surpass that of the top three for the first time, a gap that will expand in 2013, as handling at the ports grew by 5.5% y-o-y in 2013 through October, compared to a 0.1% y-o-y decline for the top three.
However, this shifting port growth pattern will not stop here. So far in 2013 throughput growth at smaller ports outside the top ten has significantly outpaced that at the larger, more established facilities. As such, in future the key sources of Chinese throughput growth look likely to be found further down the port hierarchy.
HEADLINES
- Do shipping markets want Biden or Trump for the win?
- All 18 crew safe after fire on Japanese-owned tanker off Singapore
- Singapore launching $44m co-investment initiative for maritime tech start-ups
- Cosco debuts Global Shipping Industry Chain Cooperation Initiative
- US warns of more shipping sanctions
- China continues seaport consolidation as Dalian offer goes unconditional