What direction growth?
With the halcyon days of double-digit world container growth over, the North-South trades were expected to be a shining beacon of hope in the new low-growth environment. But are they delivering on that promise?
After 2012 when volumes flat-lined in the big East-West trades (see trade definitions below) and North-South routes increased by about 5% the latter were heralded as the future of the container industry. The North-South trades were viewed by many as the best bet for carriers looking for the biggest return on investment. Carriers such as Maersk and Hamburg Süd took up that gamble with orders for big wide-beam ships designed specifically to cater for the anticipated fast-growth regions such as Latin America.
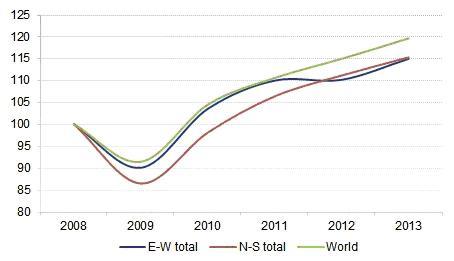
Figure 1
Development of East-West and North-South Two-Way Container Traffic (2008=100)

Source: Drewry Container Forecaster
Yet, as the above chart shows, growth in the East-West trades returned in 2013, and slightly faster than for the North-South, meaning that when measuring the period between 2008 and 2013 CAGR for both trades was almost identical at around 3%.
While both East-West and North-South routes enjoyed comparable growth last year the demand data for the first eight months of 2014 suggests that the former is accelerating, while the latter is now in reverse gear. The premise that North-South routes would outpace East-West lanes is becoming increasingly redundant.

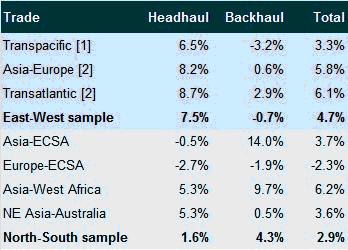
The table below shows that two-way East-West cargo growth is much improved on last year, rising by 4.7% compared to the first eight months of 2013. It also far exceeds growth for the collection of our North-South sample trades, which grew by a disappointing 2.9% year-to-date.
Table 1
Comparative Growth Between Selected East-West and North-South Trades After Eight Months 2014

Note: [1] Includes US, Canada and Mexico; [2] Includes Mediterranean
Source: Drewry Maritime Research (www.drewry.co.uk)
It is not all doom and gloom as there are still areas of growth, such as the Asia-West Africa trade, but the general trend is weak with the Latin America trades in particular performing well below expectation as the major economies of Brazil and Argentina are struggling to cope with inflation and weaker currencies that make imports more expensive.
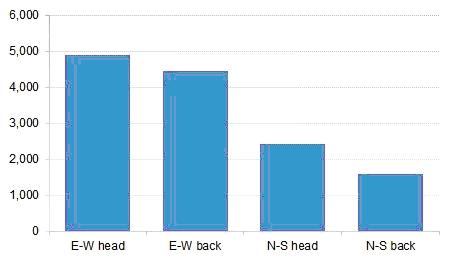
Because the East-West trades are much bigger in volume terms, even if the growth rates are similar each percentage point gain makes a far bigger contribution to the total teu count. To emphasise this, even though headhaul East-West growth was slower between 2008 and 2013 than it was for the dominant North-South leg (CAGR of 2.2% versus 2.8% respectively) it contributed twice as much in teu to the rise in world container traffic.
Figure 2
Contributions to World Loaded Container Growth 2008-13 (’000 teu)

Source: Drewry Container Forecaster
Interestingly, backhaul East-West trades are estimated to have added more to the world container pot than North-South headhaul and backhaul trades combined. This helped carriers by narrowing container imbalances, although the impact on overall revenues will not have been overly significant considering the much lower rates received on nearly all backhaul legs.
Similar to the about turn in the growth trend from North-South back to East-West, the latest demand data suggests that the rise of the backhaul East-West trades is at an end.
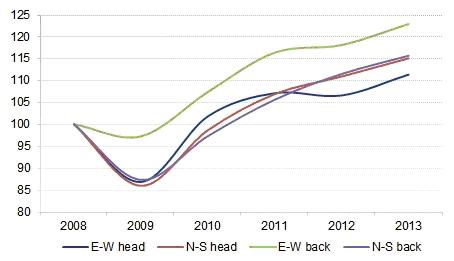
Growth in the Europe and US to Asia trades significantly outpaced that of the headhaul flows between 2008 and 13 (see Figure 3) but as the latest demand figures for 2014 show, East-West backhaul volumes are now in decline and acting as a negative drag on two-way growth.
Past North-South growth was evenly shared between the headhaul and backhaul legs, but now most of our sample trades from table 1 are showing that the return leg shipments are faring much better in 2014.
Figure 3
Development of Headhaul and Backhaul East-West, North-South Container Traffic (2008=100)

Source: Drewry Container Forecaster
Due to the size of the market the improving East-West headhaul picture is of course a big positive for carriers, with the stronger than expected Asian export flows into Europe and the US being the main reason why Drewry upgraded its growth forecast for global container handling in 2014 from 4.9% to 5.2% in the latest Container Forecaster report.
However, the slowdown in the emerging North-South trades is a major problem for carriers. A lot of newbuild ships have entered these routes with at least 80 ships of 8,000 teu currently deployed, mostly in the trades to and from East and West Coast South America, With less cargo than previously expected needing to be shipped, carriers will also need to reconsider cascading ships from East-West lanes or risk further flooding the market.
The influx of capacity into the North-South lanes means that matching supply with demand on a monthly basis is extremely difficult, leading to considerable freight rate volatility. Unless there is a sudden and unexpected upturn in volumes this scenario is expected to remain.
Next year will see more changes in respect of deployment and carrier strategic focus in the North-South routes; Hapag-Lloyd will continue its integration of CSAV’s liner activities and take on board new 9,000 teu vessels; Hamburg Süd will have similar integration to handle with the smaller Chilean line CCNI and the German carrier will also be exchanging slots in the ECSA trade in a new deal with UASC.
Our View
Cargo trends have been completely turned on their head in 2014 with the East-West trades once again the main drivers of growth. This sudden change suggests carriers require a diverse network to avoid being too exposed to underperforming routes. The slump in backhaul East-West cargo will add to carrier costs by widening trade imbalances.
HEADLINES
- Do shipping markets want Biden or Trump for the win?
- All 18 crew safe after fire on Japanese-owned tanker off Singapore
- Singapore launching $44m co-investment initiative for maritime tech start-ups
- Cosco debuts Global Shipping Industry Chain Cooperation Initiative
- US warns of more shipping sanctions
- China continues seaport consolidation as Dalian offer goes unconditional