A Story For The Season: Deliveries In A Stable Condition
With the holiday season almost upon us, deliveries of many types are the focus of attention. In shipping, deliveries into the world fleet peaked a few years ago, and then the rate of capacity delivered from the world’s shipyards went on the slide. At some point this should have started to stabilize but, with output often fairly volatile from month to month, it needs some work to identify when.
Peaking Deliveries
In the years 2006-08 an unprecedented total of 646m dwt of vessel capacity was ordered at the world’s shipyards. Although, following the economic downturn, the delivery of some of this was delayed or
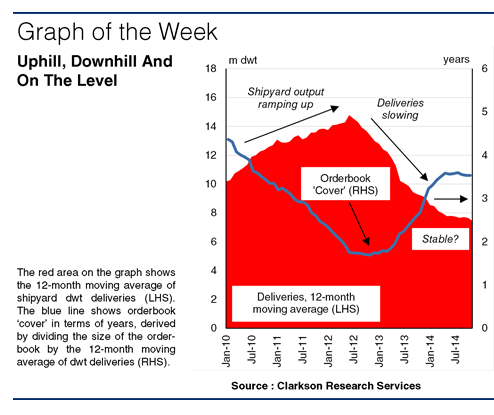
cancelled, capacity delivered rose substantially in the years 2010 to 2012, and peaked on an annual basis in 2011 at 166m dwt (on a monthly basis, 12-month moving average deliveries peaked at 14.8m dwt in June 2012). Inevitably, following the downturn, a slowdown in ordering occurred, and after the peak in output deliveries started to slide. The question was how long would the slide in deliveries last, and how quickly would surplus building capacity exit the arena?
Sliding Then Flattening
Monthly delivery data provides some of the answer. Although this can be volatile, the 12-month moving average (a metric showing the average monthly output over the last 12 months) gives an idea of ‘annual’ output capacity at any point in time. The graph shows that this had dropped to 12.8m dwt by January 2013 and then to 10.1m dwt by July 2013. By January 2014, the 12-month moving average had reached 8.6m dwt, down 42% from the peak. Shipyard output, in dwt terms at least, had slowed perhaps more quickly than many had imagined.
But, has the rate of output stabilized since then? The graph suggests yes. In April 2014, the 12-month moving average reached 8.0m dwt, and since then has remained in a fairly narrow range between 8.0m and 7.4m dwt. Clearly the rate of output has flattened. The full year delivery forecast for 2014 stands at 7.8m dwt per month, with a not too dissimilar figure currently projected for 2015.
Covering Up
Meanwhile, the line on the graph highlights an interesting side effect. As deliveries have slowed, and the orderbook has started to grow again (at 316m dwt, it is today 18% larger than at start 2013), the orderbook expressed as years of ‘cover’ in terms of the 12-month moving average rate of deliveries has increased significantly, moving from 2.2 years in July 2013 to 3.5 years today. Not quite the 4.4 years seen in 2010, but substantially more cover than the 1.7 years when deliveries went on the slide in 2012.
Onward, Upward?
So, it looks like deliveries have stabilised, and this perhaps came around a little more quickly than some expected. Moreover, whilst the environment today is still challenging for yards, a side effect of the slowdown in output has been an increase in the level of cover. When output starts to increase again is open to question, but today’s orderbook for 2015 delivery (135.1m dwt) is a little bigger than that for 2014 delivery at the start of this year (133.8m dwt), so watch this space.
HEADLINES
- Do shipping markets want Biden or Trump for the win?
- All 18 crew safe after fire on Japanese-owned tanker off Singapore
- Singapore launching $44m co-investment initiative for maritime tech start-ups
- Cosco debuts Global Shipping Industry Chain Cooperation Initiative
- US warns of more shipping sanctions
- China continues seaport consolidation as Dalian offer goes unconditional