Look Back In Anger Or Look Forward To Something New?
The month of January is often thought to be named after the Roman deity Janus, who was the god of beginnings and transitions such as doors and gates. He is usually depicted as having two faces, one looking to the future and one to the past. For the shipping markets, the end of the year always represents a chance to take stock, but how much does looking back and forward actually help us understand?
Two Way Street
Let’s start with the looking back part. It is interesting to note how often the ClarkSea Index (a weighted index of bulker, tanker, gas carrier and containership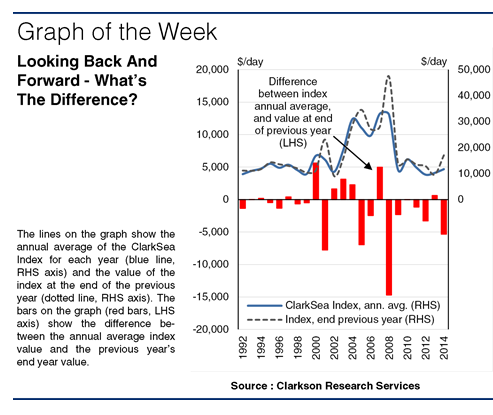 earnings) at the end of the year is a fairly good explanator of the performance of the index in the following year. The graph compares the annual average of the ClarkSea Index each year to the value of the index in the last week of the previous year, back to 1992. At face value, the two are quite well correlated (with a correlation coefficient of 89%).
A Good Signpost?
In fact the average absolute difference between the two figures across the period is about $2,900/day. On average this is equivalent to a 16% deviation between the performance during the year and the index value at the end of the previous year. With the annual average index value ranging from less than $10,000/day to more than $30,000/day, that doesn’t sound like a great deal. As with many economic series, the immediate past is a strong explanator of the present. In 11 of the years in the period under consideration, the difference was less than $1,500/day. At $14,787/day, could the end 2014 index value be seen as a signal of mild improvement in 2015 compared to the full year 2014 average of $11,743/day?
No Guarantee
Well, as they say in the financial services world, past trends are no guarantee of future performance. The difference can still be significant. Even if some shipping market drivers take time to develop, particularly on the demand side, leading to gradual shifts from year to year, across the sample here there were still 6 years where the index annual average diverged by more than 25% from the value at the end of the previous year.
Changes Of Direction
These include some significant changes in direction. Fundamentals can quickly become tight or loose enough to ensure sharp market movements from time to time. In 2000 the average index value stood more than $5,600/day above the end 1999 value as markets picked up in line with an improved world economy, and in 2008 the average value stood almost $14,700/day below its end 2007 value as the markets turned sharply downwards due to the financial crisis.
Which Way Next?
As ever, there’s plenty to consider for the shipping investor. As with Janus, looking back is one thing, but looking forward is another. One may teach the lessons of the past, which can be helpful, but fundamentals are always evolving and at the start of any year a keen eye needs to be kept on whether things are getting tight or loose enough to send markets into spikier form. Good luck with your view for 2015!
HEADLINES
- Do shipping markets want Biden or Trump for the win?
- All 18 crew safe after fire on Japanese-owned tanker off Singapore
- Singapore launching $44m co-investment initiative for maritime tech start-ups
- Cosco debuts Global Shipping Industry Chain Cooperation Initiative
- US warns of more shipping sanctions
- China continues seaport consolidation as Dalian offer goes unconditional