North/South: Europe: ECSA slowdown
Europe-East Coast South America container volumes will have shrunk in 2014 when the final data comes in.
Following a narrow election victory, Brazilian President Dilma Rousseff faces a difficult second term getting to grips with a corruption scandal at the state-controlled oil giant Petrobas and reviving a stagnant economy.
The slowdown in Brazil’s economic growth is evident in the moribund container trade between Europe and the East Coast South America. This trade has proved to be a major disappointment with the latest statistics from Datamar reporting a big drop in demand in both directions for November.
Figure 1
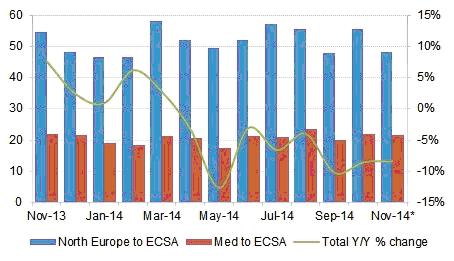
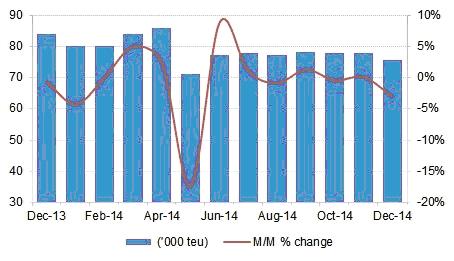
Southbound Europe to ECSA Container Traffic (’000 teu)
Notes: *Preliminary data; All data includes dry, reefer and tank cargoes
Source: Datamar (www.datamar.com.br)
Containerised cargo from Europe to ECSA decreased by 8.4% year-on-year in November, which was only a marginal improvement on the 8.6% and 10.3% drops recorded in September and October respectively.
The trade has seen annual declines in every month since March of last year. The latest monthly drop was the result of much weaker volumes from North Europe, which fell by 11.4%, while the smaller trade from the Mediterranean fared better with a decrease of 0.9%. Trade from North Europe represents approximately 70% of the total Europe to ECSA traffic.
Figure 2
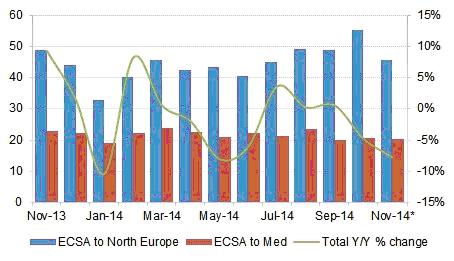
Northbound ECSA to Europe Container Traffic (’000 teu)
Notes: *Preliminary data; All data includes dry, reefer and tank cargoes
Source: Datamar (www.datamar.com.br)
Things were equally dire in the northbound direction in November. Datamar reported that ECSA to Europe shipments were down by 7.8% in the month. Exports to North Europe dropped 6.4% to 45,500 teu, while Mediterranean volumes fell by 10.9% to 20,200 teu.
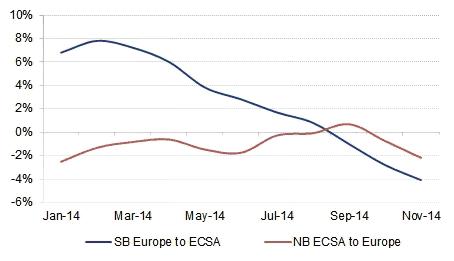
The rolling 12-month averages suggest that both legs of the trade ended 2014 in negative territory. Including November’s data, the southbound Europe to ECSA rolling average was -4.1%, while the northbound average was -2.2%.
Figure 3
12-Month Rolling Average of Europe-ECSA Container Traffic (% change on previous year)
Source: Drewry Maritime Research (www.drewry.co.uk), derived from Datamar (www.datamar.com.br)
These are hardly the sort of numbers that carriers were hoping for when they invested in new and bigger ships for the route. Discounting Grimaldi’s multipurpose ships, only three carriers (Maersk, MSC and Hamburg Sud) deploy ships on this route, although many others are present via slot charter arrangements. Maersk has indicated that it is considering reducing its capacity on Brazil routes, but so far capacity has remained pretty constant with very few missed voyages.
Figure 4
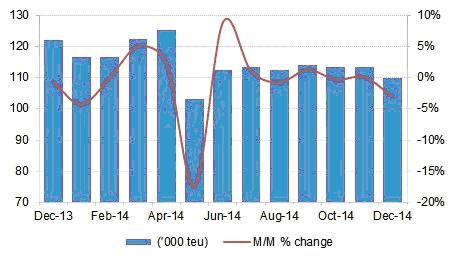
Southbound Europe to ECSA Capacity (’000 teu)
Source: Drewry Maritime Research (www.drewry.co.uk)
Figure 5
Northbound ECSA to Europe Capacity (’000 teu)
Source: Drewry Maritime Research (www.drewry.co.uk)
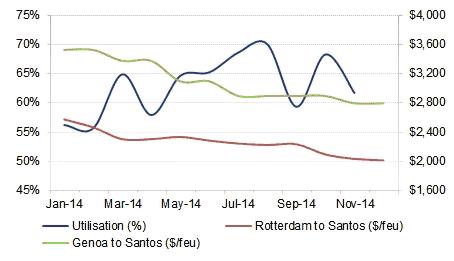
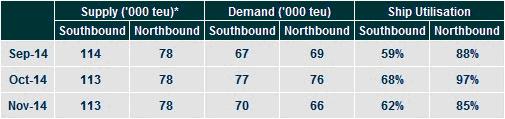
Weaker demand in November, coupled with unchanged capacity reduced our estimated average utilisation for ships sailing southbound from Europe to ECSA for the month to 62%, down from 68% in October. Despite ships being less full, southbound spot rates only saw a minor decline in the last two months of 2014. Drewry’s Container Freight Rate Insight reports that all-in spot rates from Rotterdam to Santos fell from $2,090/40ft container in October to $2,030/40ft and $2,010/40ft in November and December respectively.
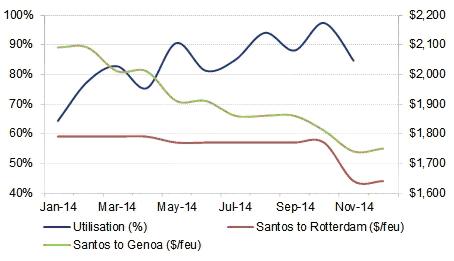
Similarly, northbound ship utilisation is thought to have decreased in November, dropping to an estimated 85%, down from 97% in November. With a large share of northbound cargo moving under commodity contracts the spot market is not particularly representative, but again spot rates showed minor monthly declines in November and December.
Figure 6
Southbound Europe to ECSA Utilisation v Rates
Sources: Drewry Maritime Research (www.drewry.co.uk), Drewry Container Freight Rate Insight (www.drewry.co.uk/cfri)
Figure 7
Northbound ECSA to Europe Utilisation v Rates
Sources: Drewry Maritime Research (www.drewry.co.uk), Drewry Container Freight Rate Insight (www.drewry.co.uk/cfri)
Table 1
Europe to ECSA – Estimated Monthly Supply/Demand Position
Notes: *Based on effective capacity after deductions are made for deadweight and high-cube limitations and then again for out-of-scope cargoes, ie. those relayed to areas outside the range. Where relevant,operational capacities have also been adjusted for slots allocated to wayport cargoes. Data is subject to change
Source: Drewry Maritime Research (www.drewry.co.uk)
Our View
Carriers will need to revaluate their capacity needs in this trade, which looks set for a prolonged downturn as the major Latin America economies of Brazil and Argentina will take time to recover. Moreover, questions must be raised about whether Brazil’s sub-par infrastructure could handle extra container loads. Future investment could be hampered by the involvement of local construction firms in the Petrobas scandal.
HEADLINES
- Do shipping markets want Biden or Trump for the win?
- All 18 crew safe after fire on Japanese-owned tanker off Singapore
- Singapore launching $44m co-investment initiative for maritime tech start-ups
- Cosco debuts Global Shipping Industry Chain Cooperation Initiative
- US warns of more shipping sanctions
- China continues seaport consolidation as Dalian offer goes unconditional