Lifting The Lid On Trends In China’s Box Throughput
Robust growth in the Chinese economy drove a rapid increase in container exports from the country following its entry into the WTO in 2001. At an aggregate level, the pace of this expansion has slowed in recent years, contributing to softer box throughput growth at mainland Chinese ports, but there has been a significant difference in trends in throughput between China’s large and small container ports.
Uplift In Throughput Slows
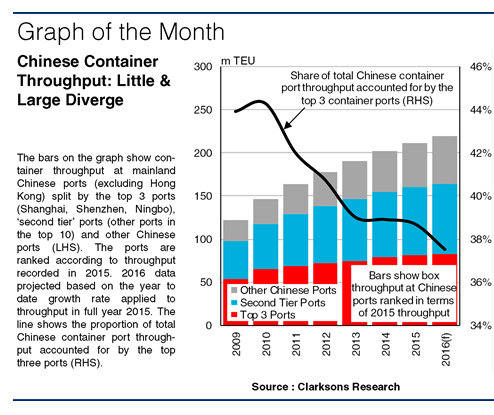
China is home to some of the world’s busiest container ports, with Chinese box throughput totalling 211.6m TEU in 2015, 32% of global volumes. However, growth in lifts at mainland Chinese ports has eased from 8.5% p.a. on average in 2011-14, to 4.5% in 2015. This reflects slower growth in Chinese exports, with box throughput growth slowing further to 3.7% y-o-y in the first ten months of 2016. However, trends have differed between the largest and smaller ports.
Top Ports Under Pressure
Growth in lifts at China’s top three mainland container ports, Shanghai, Shenzhen and Ningbo, has eased from 5.0%p.a. on average in 2011-14, to 3.9% in 2015 and 0.5% in January-October 2016. Shenzhen has taken the biggest hit, with lifts down 0.6% in 2016 so far, following average growth of 1.5% p.a. in 2011-15. These trends have been driven by greater competition from other ports in the Pearl River Delta, and the relocation of manufacturing from the region to inner provinces. Overall, the share of China’s lifts accounted for by the top three ports fell to 39% in 2015, from 44% in 2009.
At the ‘second tier’ ports (others within China’s top ten), box lifts rose on average by 9.8% p.a. in 2011-14, outpacing that at the top three ports. This reflects both the diversification in manufacturing locations, and rapid upsizing in the boxship sector. Operators have deployed newly delivered large ships at more-established ports, which in turn appears to have led to the deployment of other vessels at ‘second tier’ ports. For instance, the introduction of additional direct services and the development of the Nansha port area has supported lifts at Guangzhou, with some operators now replacing calls at Shenzhen with Nansha and other ports.
Competition Heating Up
Meanwhile, total throughput at Chinese ports outside of the top ten has continued to rise firmly, growing by 13% p.a. in 2011-14 and 9.3% in 2015. There were 10 Chinese ports with lifts above 2m TEU in 2009, but this number had risen to 18 by 2015. Lifts at ports outside of China’s top ten have been supported by ongoing infrastructure development, and greater competition between ports. While previously many cargoes from inner provinces were shipped through the large coastal ports, some operators have now begun direct services from inland river ports.
So, the share of Chinese box throughput accounted for by the top three ports has come under pressure in recent years, with the smaller ports representing the fastest growing element of China’s total container lifts. Asian container trade, including domestic Chinese volumes, now appears to be picking up pace again, but the contrast between trends in China’s large and smaller ports might continue for a while yet.
Source: Clarkson Research Services Limited
HEADLINES
- Reversal! HMM Union Drops Opposition, Headquarters Relocation to Busan Confirmed
- Five Major Shipping Lines Have Over 30 Vessels Trapped in the Strait of Hormuz
- COSCO SHIPPING Holdings Achieves RMB 5.877 Billion in Net Profit Attributable to Parent Company in Q1 2026
- VLCC Idle Rate Climbs to 55%! Tanker Owners Grapple with Scarcity of Physical Cargoes
- COSCO SHIPPING Energy: Acquires 100% Equity of Dalian Investment; Q1 Net Profit Soars by 206.7%
- China's largest domestically built LNG carrier delivered