OPEC’s oil market statistics may support bunker prices next week, expert says
World fuel indexes did not have any firm trend during the week demonstrating insignificant and irregular changes. Geopolitical risk and the oil nations’ production cuts gave a floor to prices while fears of a too strong U.S. supply response and U.S. oil inventories limited the upside evolution. One of the keys for the balance between supply and demand of oil is still adherence by OPEC and a number of other exporters to an agreement to cut output.
MABUX World Bunker Index (consists of a range of prices for 380 HSFO, 180 HSFO and MGO at the main world hubs) turned into slight downward changes in the period of Feb.02 – Feb.09:
380 HSFO – down from 306.07 to 303.14 USD/MT (-2,93)
180 HSFO – down from 348.79 to 345.71 USD/MT (-3,08)
MGO – down from 535.79 to 529.07 USD/MT (-6,72)
The early signs of the first month of OPEC deal suggest that the cartel is coming close to de-livering on its promises. According to Platts, the 10 OPEC countries have achieved a 91 percent compliance rate with the targeted cuts (cartel pumped 32.3 million barrels a day last month). Meantime, these efforts were offset by increases from Iran, Nigeria and Libya that were permitted under the terms of the agreement. The figures are important as Platts is one of the sources used in OPEC’s official secondary sources survey in its monthly oil market reports (to be published Feb.13).
As per preliminary estimate, Saudi Arabia, OPEC’s largest producer, led the January cuts with a reduction of half a million barrels a day, going below 10 million for the first time in almost two years. Its allies the United Arab Emirates and Kuwait followed by cutting a combined 310,000 barrels a day.
Production in Iraq, which tried to secure an exemption from the cuts, declined by 120,000 barrels a day to 4.51 million.
At the same time, OPEC members not required to make cuts, added 270,000 barrels a day in January. Libya ramped up output to 690,000 barrels a day, the highest level in more than two years, as it reopened fields and export terminals that had been disrupted by conflict. Nigeria, also wracked by internal unrest, boosted production by 9.3 percent to 1.64 million barrels a day. Iran, which was allowed to continue restoring output to pre-sanctions levels, pumped 3.8 million barrels a day, the most since 2010.
Russia, the largest of the non-members participating in the deal, curbed production by 117,000 barrels a day last month. Russia pledged to gradually reduce supply by as much as 300,000 barrels a day, more than half the total non-OPEC pledge for a 558,000-barrel-a-day reduction.
A tension between Tehran and Washington is the supporting factor for prices as well. The Treasury Department published a list of 13 individuals and 12 entities facing new restrictions for supporting the missile program in Iran. Still, the new sanctions weren’t directed at Iran’s nuclear program and wouldn’t directly affect the agreement signed by Obama’s administration and eased restrictions in exchange for Iran’s promise not to develop nuclear weapons.
In response to new sanctions Iran promised to take action against a number of American individuals and companies, and carried out further missile tests during an annual military exercise. While the missile tests didn’t contravene the nuclear accord signed in 2015, they are seen by some as going against a United Nations Security Council resolution that enshrines the agreement.
While concerns rose that new U.S. sanctions against Iran could be extended to affect crude and fuel supplies, rising U.S. production undermines efforts by OPEC and other producers to end global oil oversupply. 17 oil rigs were added in the U.S. in the week to Feb. 3, bringing the total up to 583, the most since October 2015. As EIA estimates, oil output will average 9.53 million barrels a day in 2018, up from 9.3 million projected in January. Production averaged 8.94 million a day last month.
Prices also came under pressure from signs of slowing demand from China. Country’s implied oil demand growth eased to 2.5 percent in 2016, down from 3.1 percent in 2015 and 3.8 percent in 2014, led by a sharp drop in diesel consumption and as gasoline usage eased from double-digit growth. The slowing occurred as the economy expanded by only 6.7 percent in 2016, the slowest pace in 26 years.
It is also expected, that around 6 percent of Chinese refining capacity would shut down at some point during the first half of the year, equivalent to around 900,000 bpd of capacity. A 6.7-percent reduction to 68.81 million tonnes between 2016 and 2017 crude import quotas for China’s independent refiners will weigh on the overall import demand.
Feb.13 – OPEC’s monthly oil market report and Feb.17 – first report from a committee in charge of monitoring compliance with oil cut deal – may place some upward pressure on fuel indexes. We expect bunker prices may turn into slight upside trend next week.
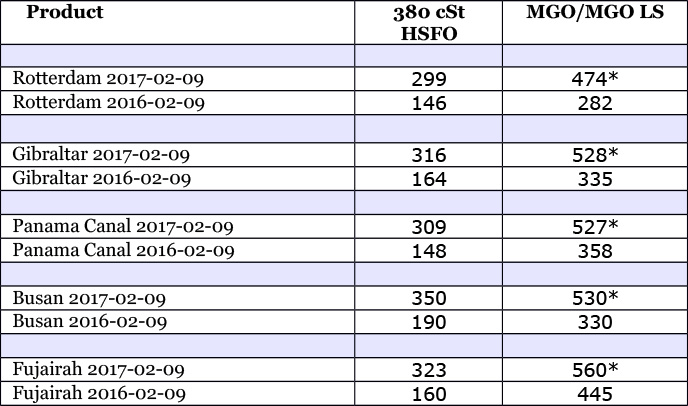
* MGO LS
All prices stated in USD / Mton
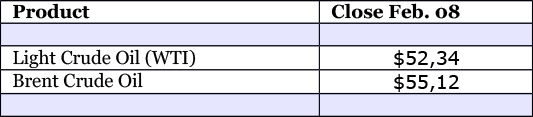
All time high Brent = $147.50 (July 11, 2008)
All time high Light crude (WTI) = $147.27 (July 11, 2008)
Source: Marine Bunker Exchange
HEADLINES
- Do shipping markets want Biden or Trump for the win?
- All 18 crew safe after fire on Japanese-owned tanker off Singapore
- Singapore launching $44m co-investment initiative for maritime tech start-ups
- Cosco debuts Global Shipping Industry Chain Cooperation Initiative
- US warns of more shipping sanctions
- China continues seaport consolidation as Dalian offer goes unconditional