Expert says bunker prices may continue mixed trends next week

World fuel indexes continued irregular fluctuations this week while market focused on two main drivers: OPEC’s supply-cut deal and rebound in U.S. drilling activity. The IEA increased its 2016 estimates for world oil demand growth for a third month, and boosted its outlook for 2017, anticipating an increase of 1.4 million barrels a day this year. It also predicts that world oil inventories will fall by 600,000 barrels a day during the first half of the year if OPEC sticks to its agreement. While stockpiles in industrialized nations have declined for five months in a row, they still remain significantly above average levels.
MABUX World Bunker Index (consists of a range of prices for 380 HSFO, 180 HSFO and MGO at the main world hubs) edged up slightly in the period of Feb.09 – Feb.16:
380 HSFO – up from 303.57 to 310.57 USD/MT (+7.00)
180 HSFO – up from 346.14 to 351.57 USD/MT (+5.43)
MGO – up from 529.07 to 530.71 USD/MT (+1.64)
OPEC cut its crude oil production by 890,000 bpd from December to average 32.14 million bpd in January. Production in January decreased the most in Saudi Arabia, Iraq and the UAE, while production in Nigeria, Libya and Iran increased. The cartel did not provide a compliance rate percentage, but as per different estimations it is around 90-93 percent.
Secondary sources figures show that Saudi Arabia cut deeper than promised, and reduced output to below 10 million bpd last month, to 9.946 million bpd, down by 496,200 bpd compared to December (more than the 486,000-bpd-cut it promised in the deal).
On the other hand, Iraq, Venezuela, Angola and Algeria cut less than promised, while production in Nigeria rose by 101,800 bpd, Libya’s output increased by 64,700 bpd, and Iran’s output rose by 50,200 bpd. Nigeria and Libya were exempt from the cut-deal while Iran was allowed by raise its production slightly, by up to 90,000 bpd.
The additional cuts of 558,000 bpd promised from non-OPEC countries is a little less clear – the IEA projects that Russia has slashed output by 100,000 bpd in January. Russia promised to cut 300,000 bpd over the course of the six-month compliance period. Data from other countries is also unclear although the IEA said that Oman appears to have reduced output by 45,000 bpd.
Russia for its part will decide in April or May on whether to extend the output-cut deal with OPEC. There are signs that country’s output may be falling but that exports remain high, as its producers protect their export markets at the cost of lower domestic supplies. Taken these trends under consideration, OPEC might have to extend its cuts for a longer period than the currently planned first half of 2017.
Nevertheless, that is a good sign that the oil market is adjusting towards some stage of bal-ance. As per IEA, if OPEC can continue with its high compliance rate, global oil inventories could decline by around 0.6 mb/d on average between January and June.
The factor of risk is that oil supplies outside and within OPEC may increase in near-term outlook, offsetting the progress made by the OPEC deal. Rising production in Canada, Brazil and the U.S. may transform in additional 750,000 bpd in 2017.
In the United States rising drilling activity is pushing up production. Drillers added 8 oil rigs in the week to Feb. 10, bringing the total U.S. count to 591, the most since October 2015. During the same week last year, when prices were around $30 per barrel, there were just 439 active oil rigs.
Besides, some 10 million barrels of crude from the U.S.’s strategic reserve are scheduled to be sold later this month. The shipment is part of a total 25 million barrels, to be sold over a period of three years. It represents less than 2 percent of the strategic reserve’s current capacity, which is calculated at 695.1 million barrels. As such, the sale is unlikely to have a lasting impact on fuel prices, although a brief fluctuation is likely.
Demand growth from China and India might not be as supportive as 2016. China’s crude imports in January slipped from a record as refiners eased buying before the Lunar New Year break, when industrial activity tends to slow during the country’s most-important holiday.
India’s monthly oil demand also fell the most since May 2003 adding some pressure on global fuel indexes at the moment. This decline in demand is due to demonetization: Prime Minister Narendra Modi in November withdrew high-value currency notes in a country where almost all consumer payments are in cash. Growth in gross domestic product may slow to 6.5 percent in the year through March from 7.9 percent the previous year.
The present market situation looks like oil producers will have to cut production more quickly to drain the global oversupply this year while rising production in the United States is undermining OPEC’s efforts to cut oil output. We expect irregular changes in bunker prices will continue next week.
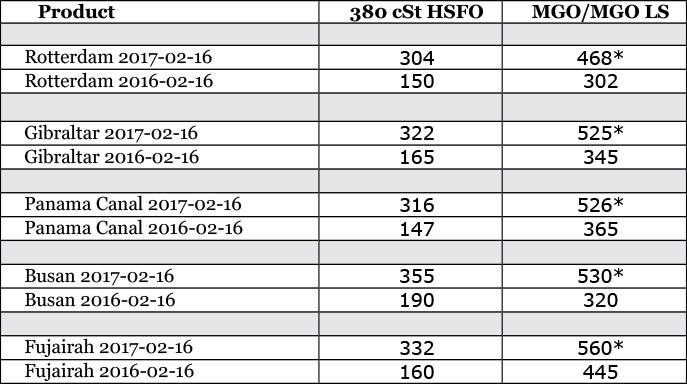
* MGO LS
All prices stated in USD / Mton
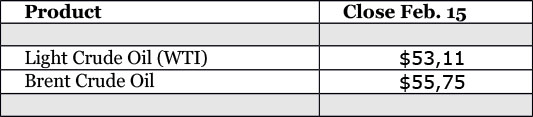
All time high Brent = $147.50 (July 11, 2008)
All time high Light crude (WTI) = $147.27 (July 11, 2008)
Source: Marine Bunker Exchange
HEADLINES
- Dual-Fuel Fleet Surges to 400 Ships as Alternative-Fuel Investment Defies Market Slowdown
- Do shipping markets want Biden or Trump for the win?
- All 18 crew safe after fire on Japanese-owned tanker off Singapore
- Singapore launching $44m co-investment initiative for maritime tech start-ups
- Cosco debuts Global Shipping Industry Chain Cooperation Initiative
- US warns of more shipping sanctions