Dynagas LNG Partners To Focus on Additional Contract Coverage During 2017

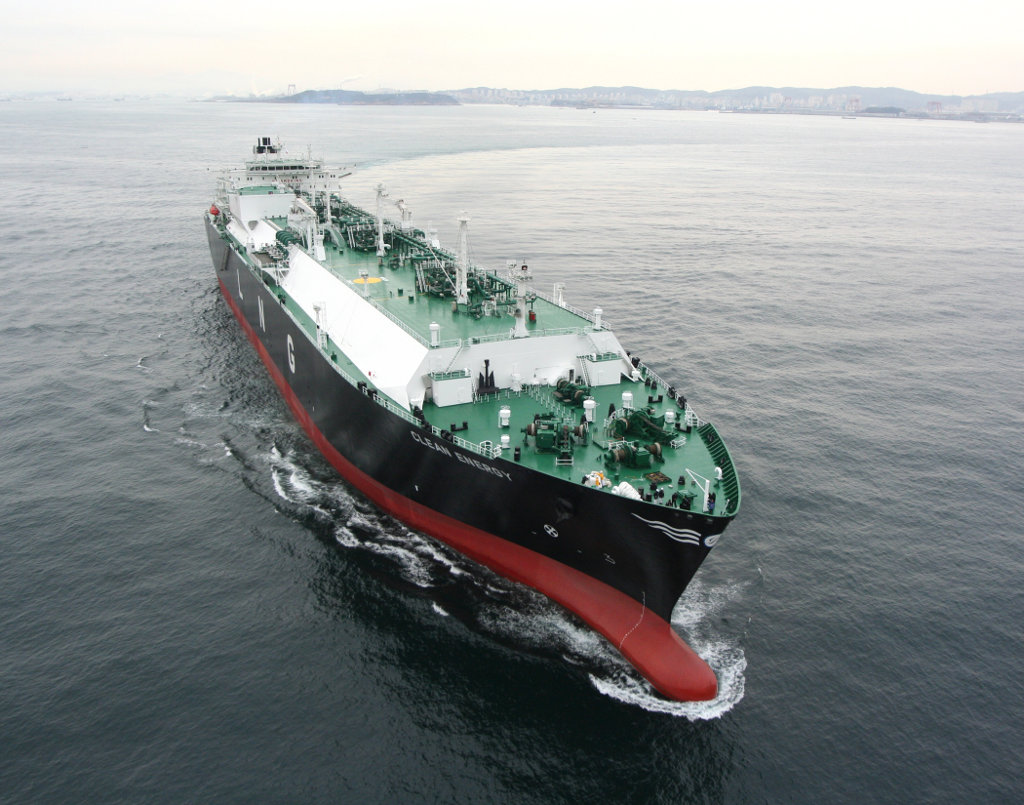
Dynagas LNG Partners LP, an owner and operator of liquefied natural gas (“LNG”) carriers, announced its results for the three months and year ended December 31, 2016.
Three Months and Year Ended December 31, 2016 Highlights:
Net income during the three months and year ended December 31, 2016 of $15.5 million and $66.9 million, respectively;
Earnings per common unit for the three months and year ended December 31, 2016 of $0.39 and $1.69, respectively;
Adjusted Net Income (1) for the three months and year ended December 31, 2016 of $17.3 million and $74.1 million, respectively;
Adjusted Earnings per common unit (1) (2) for the three months and year ended December 31, 2016 of $0.44 and $1.89, respectively;
Distributable Cash Flow (1) during the three months and year ended December 31, 2016 of $21.3 million and $89.6 million, respectively;
Adjusted EBITDA (1) for the three months and year ended December 31, 2016 of $33.9 million and $139.5 million, respectively;
$82.6 million of reported cash and $112.6 million of available liquidity as of December 31, 2016;
Quarterly cash distribution of $0.4225 per common unit in respect of the fourth quarter and $0.5625 per preferred unit in respect of the most recent period.

Recent Developments:
Quarterly Common and Subordinated Unit Cash Distribution: On January 4, 2017, the Partnership’s Board of Directors announced a quarterly cash distribution of $0.4225 per common and subordinated unit in respect of the fourth quarter of 2016. This cash distribution was paid on January 19, 2017 to all common and subordinated unitholders of record as of January 11, 2017.
Series A Preferred Units Cash Distribution: On January 23, 2017, the Partnership’s Board of Directors also announced a cash distribution of $0.5625 per unit of its Series A Preferred Units (NYSE:DLNG PR A) for the period from November 12, 2016 to February 11, 2017, which was paid on February 13, 2017 to all unitholders of record as of February 5, 2017.
Conversion of Sponsor’s Subordinated Units into Common Units: On January 23, 2017, all conditions were satisfied for the expiration of the subordination period with regards to the 14,985,000 subordinated units owned by the Partnership’s Sponsor. As such, as of the same date, all subordinated units converted into common units on a one-for-one basis (“the Converted Common Units”). Following the issuance of the Converted Common Units, the Partnership, as of the date of this release, has 35,490,000 issued and outstanding common units and the Partnership’s Sponsor retains a 43.9% interest in them.
Chief Executive Officer Commentary:
Tony Lauritzen, Chief Executive Officer of the Partnership, commented:
“We are pleased to report our earnings for the fourth quarter and year ended December 31, 2016.
“The year ended December 31, 2016 has been a record financial year for us, during which Adjusted EBITDA increased by approximately 23% as compared to the full year ended December 31, 2015, mainly to the acquisition from our Sponsor of the Lena River in late 2015. Our fleet of six LNG Carriers performed at 100% utilization during 2016, which contributed positively to our full year financial results. Our Adjusted Earnings per common unit for the year ended December 31, 2016 amounted to $1.89, which is an increase of approximately 16% compared to the year ended December 31, 2015. The results for the quarter ended December 31, 2016 have been overall strong too, with a 19% increase in Adjusted EBITDA, compared to the same period in 2015.
“Our revenues are derived from the employment of our vessels on fixed multi-year charter contracts. The revenues we earn under those charter contracts are on a fixed day rate basis and not directly linked to commodity price fluctuations. On January 19, 2017, we paid quarterly cash distribution of $0.4225 per common and subordinated unit with respect to the fourth quarter of 2016. Since our initial public offering in November 2013, we have paid total cash distributions amounting to approximately $5.10 per common and subordinated unit. On February 13, 2017, we paid a cash distribution of $0.5625 per unit on our Series A Preferred Units for the period from November 12, 2016 to February 11, 2017 to all holders of the Series A Preferred Units as of February 5, 2017.
“With our fleet 86% contracted through 2017 and 75% contracted through 2018 and 2019, and with an estimated fleet-wide average remaining contract duration of 10.7 years, we intend to continue to focus on obtaining additional contract coverage, particularly in 2017, managing our operating expenses and continuing the safe operation of our fleet.
“I look forward to working with our team towards meeting our goals, which we believe will continue to benefit our unitholders.”
Three Months Ended December 31, 2016 and 2015 Financial Results
Net Income for the three months ended December 31, 2016 was $15.5 million, compared to Net Income of $14.8 million in the corresponding period of 2015, which represents a 4.4% increase. Adjusted Net Income for the three months ended December 31, 2016 was $17.3 million, compared to Adjusted Net Income of $15.0 million in the corresponding period of 2015, which represents a 15.0% increase. The increase in both Net Income and Adjusted Net Income was mainly attributable to the contribution of net revenues relating to the Lena River to operating results. The Lena River was acquired from Dynagas Holding Ltd., the Partnership’s Sponsor, late in December 2015.
Adjusted EBITDA for the three months ended December 31, 2016 increased by 18.9% across the quarters (fourth quarter 2016 Adjusted EBITDA of $33.9 million, compared to fourth quarter 2015 Adjusted EBITDA of $28.5 million), which was due to the factors discussed above.
The Partnership’s Distributable Cash Flow for the three-month period ended December 31, 2016 was $21.3 million, compared to $18.0 million in the corresponding period of 2015, which represents an increase of $3.2 million, or 17.9%.
For the three-month period ended December 31, 2016, the Partnership reported Earnings per common unit and Adjusted Earnings per common unit basic and diluted of $0.39 and $0.44, respectively, after taking into account the Series A Preferred Units interest on the Partnership’s net profit. Earnings per common unit and Adjusted Earnings per common unit, basic and diluted are calculated on the basis of a weighted number of 20,505,000 units outstanding during the period, in the case of Adjusted Earnings per common unit after reflecting the impact of the non-cash items presented in Appendix B.
Please refer to the definitions and reconciliation of these measures to the most directly comparable financial measures calculated and presented in accordance with U.S. GAAP in Appendix B.
Voyage revenues increased to $41.4 million for the three-month period ended December 31, 2016, from $37.0 million for the same period of 2015, due to the increase in Revenue earning days from 461.1 days during the fourth quarter of 2015 to 552 days during the fourth quarter of 2016, which is a result of the growth of the Partnership’s fleet discussed above.
Vessel operating expenses increased by $0.5 million to $6.7 million in the three-month period ended December 31, 2016, from $6.2 million for the same period of 2015. This increase is exclusively attributable to the ownership of the Lena River.
The Partnership reported average daily hire gross of commissions(1) of approximately $78,250 per day per vessel in the three months ended December 31, 2016, compared to approximately $78,900 per day per vessel in the same period of 2015. During the three-month period ended December 31, 2016, the Partnership’s vessels operated at 100% utilization.
(1) Average daily hire gross of commissions represents voyage revenue without taking into consideration the non-cash time charter amortization expense and amortization of prepaid charter revenue, divided by the Available Days in the Partnership’s fleet as described in Appendix B.
Amounts relating to variations in period-on-period comparisons shown in this section are derived from the condensed financials presented below.
Liquidity/ Financing/ Cash Flow Coverage
As of December 31, 2016, the Partnership reported cash of $82.6 million (including the aggregate $25.0 million minimum cash liquidity requirements imposed by the Partnership’s lenders). Total indebtedness outstanding as of December 31, 2016 was $722.5 million, $32.5 million of which is repayable within one year.
The Partnership’s liquidity profile is further enhanced by the $30.0 million of borrowing capacity under the Partnership’s revolving credit facility with its Sponsor, which is available to the Partnership at any time until November 2018 and remains available in its entirety as of the date of this release.
As of December 31, 2016, the Partnership reported working capital surplus of $7.1 million.
During the three months ended December 31, 2016, the Partnership generated net cash from operating activities of $23.3 million, compared to $28.7 million in the same period of 2015. This decrease was mainly attributable to negative working capital variations between the two periods that overlapped the excess operating cash flows that the Lena River contributed to the Partnership for the quarter ended December 31, 2016.
Vessel Employment
As of February 27, 2017, the Partnership had contracted employment (2) for 86% of its fleet estimated Available Days for 2017 and 75% of its fleet estimated Available Days for 2018 and 2019.
As of the same date, the Partnership’s contracted revenue backlog estimate (3) was approximately $1.56 billion, with an average remaining contract term of 10.7 years.
(2) Time charter coverage for the Partnership’s fleet is calculated by dividing the fleet contracted days on the basis of the earliest estimated delivery and redelivery dates prescribed in the Partnership’s current time charter contracts net of scheduled class survey repairs by the number of expected Available days during that period.
(3) The Partnership calculates its contracted revenue backlog by multiplying the contractual daily hire rate by the expected number of days committed under the contracts (assuming earliest delivery and redelivery and excluding options to extend), assuming full utilization. The actual amount of revenues earned and the actual periods during which revenues are earned may differ from the amounts and periods shown in the table below due to, for example, dry-docking and/or special survey downtime, maintenance projects, off-hire downtime and other factors that result in lower revenues than the Partnership’s average contract backlog per day. Certain time charter contracts that the Partnership recently entered into with Yamal Trade Pte. are subject to the satisfaction of important conditions, which, if not satisfied, or waived by the charterer, may result in their cancellation or amendment before or after the charter term commences and in such case the Partnership may not receive the contracted revenues thereunder.
Full Report
Source: Dynagas LNG Partners LP
HEADLINES
- Do shipping markets want Biden or Trump for the win?
- All 18 crew safe after fire on Japanese-owned tanker off Singapore
- Singapore launching $44m co-investment initiative for maritime tech start-ups
- Cosco debuts Global Shipping Industry Chain Cooperation Initiative
- US warns of more shipping sanctions
- China continues seaport consolidation as Dalian offer goes unconditional