Turkey raises fines for marine pollution caused by ships by 41 pct
In the shipping industry, seaborne trade has generally been regarded as a strong and steady performer, with 4.8bt added since the year 2000, bringing total volumes to 11.1bt in 2016. Although the rate of growth appears to be settling to around 2-3% p.a. currently, the absolute volumes contributed to world seaborne trade are still at historically high levels…
Topping Up Volumes
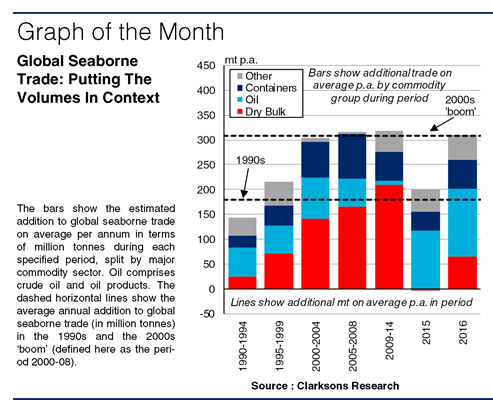 2015 saw the rate of growth in global seaborne trade ease to 1.8%, which was the slowest pace of expansion since volumes contracted in 2009. Trade volumes increased by 195mt in 2015, which was slightly above the average annual increase in the 1990s (180mt), but lower than the average annual addition in the 2000s ‘boom’ (defined here as 2000-08). But, in 2016, it looks like trade bounced back to much more significant growth. While at a first glance seaborne trade seems to have grown at a moderate pace in 2016 (2.9% compared to a CAGR of 4.4% in 2000-08), in terms of tonnes, the 309mt of additional seaborne trade was well above the average annual addition in the 1990s, and in line with volumes added in the 2000s ‘boom’.
Big Volumes, Big Business
Given the scope of the shipping industry (2.7bt of seaborne trade has still been added since the financial crisis), even with a small reduction in the percentage rate of y-o-y growth, additional annual volumes have been noteworthy. In fact, as the Graph of the Month shows, the volume added in 2016 was just as strong as the average in the ‘boomy’ 2000s. So, while the percentage growth rates appear steady, the extra volumes are still very punchy indeed.
Overall, at the more modest levels of growth in the 2013-16 period, when seaborne trade expanded on average by 2.9% p.a., almost 300mt was added on average p.a. This was just 4% below the volumes added in the 2000s ‘boom’ and it was impressively 64% above the 1990s annual average and 28% above the prior long-term historical average (1985-2012).
Shifts In Volume Growth
Under the bonnet of seaborne trade, of course the drivers of growth are changing all the time. In the 2000s ‘boom’, in terms of added trade volumes, around 50% of the 2.8bt of additional trade was accounted for by growth in dry bulk volumes, with robust Chinese dry bulk import demand a key driver of global trade trends. But seaborne dry bulk trade declined in 2015, and its share of growth in world seaborne trade fell to just 12% in 2015-16. Meanwhile, combined crude oil and oil products trade growth accounted for 50% of global trade expansion in 2015-16, compared to 23% in 2000-08. Elsewhere, the share accounted for by container trade growth fell slightly from 26% in 2000-08 to 20% in 2015-16.
So, the percentage rate of seaborne trade growth may not always match up to the boom years and the demand drivers are always shifting. But, taking a closer look, the additional trade volumes recently appear just as firm as they ever have been. Of course, to an extent it depends on how you measure it, but the absolute additional volumes just show the impetus that seaborne trade continues to provide.
Source: Clarksons
HEADLINES
- Dual-Fuel Fleet Surges to 400 Ships as Alternative-Fuel Investment Defies Market Slowdown
- Do shipping markets want Biden or Trump for the win?
- All 18 crew safe after fire on Japanese-owned tanker off Singapore
- Singapore launching $44m co-investment initiative for maritime tech start-ups
- Cosco debuts Global Shipping Industry Chain Cooperation Initiative
- US warns of more shipping sanctions