Expert says bunker prices movements to remain mixed with no firm trend in the near future

World fuel indexes little changed during the week. There were still no any news or factors with real driver potential to set up steady trend vector for fuel indications. OPEC is preparing for an oil output cut extension, having been left with no other options as U.S. drillers continue adding rigs, clearly planning to keep on expanding their output as current international prices seem to suit them fine.
MABUX World Bunker Index (consists of a range of prices for 380 HSFO, 180 HSFO and MGO at the main world hubs) has increased slightly in the period of May. 04 – May. 11:
380 HSFO – up from 281.57 to 284.64 USD/MT (+3.07)
180 HSFO – up from 323.21 to 326.79 USD/MT (+3.58)
MGO – up from 498.93 to 502.50 USD/MT (+3.57)
Crude is now back to levels last seen before the Organization of the Petroleum Exporting Countries (OPEC) and other producers reached an agreement to cut output by almost 1.8 million barrels per day (bpd) during the first half of the year. The question now is whether a cut will prove OPEC’s viability in influencing major trends in the market. Its members have long been focused on their own domestic agendas. Saudi Arabia – on its IPO, Iran and Iraq – on seizing market share and recovering production, while many other member states including Nigeria, Libya and Venezuela continue to struggle with instability. At the moment the market seems to be much further away from a balanced situation and the decline is being driven by expanding U.S. output. On May 23 in Vienna, the cartel will meet to make a final decision regarding the future of the 1.2 million-barrel output cut.
Iran and Iraq were both partly exempt from the production cuts, with Iran successfully recovering production to 3.8 million bpd. There’s little reason for them to protest an extension of the deal, especially when they’ve been able to seize market share from others, like Saudi Arabia. Meantime, Iran said that it wants to increase its production to 5 million bpd by 2021, which can undermine cut agreement and make it ineffective. For the moment the official data shows Iran has largely stuck to its commitment for production in the three months to March, exceeding slightly its output in February and pumping below its quota in January and March.
Russia has stated it is ready to extend the oil cut deal with OPEC and is inclined to believe that the extension is reasonable. Under the deal between OPEC and 11 non-OPEC producers, Russia had to cut output by 300,000 bpd by the end of the first half. On May 04 sources from the Energy Ministry told media that Russia had exceeded its assigned quota for crude oil production cuts by 790 barrels a day. So far Russia had given its principal support of an extension.
Adding to the supply glut is the fact that Libya’s crude oil production has exceeded 800,000 bpd for the first time since 2014, and could average up to 1.2 million bpd for the rest of this year if oil flows freely.
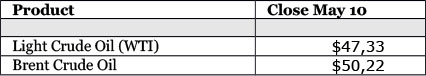
U.S. crude oil inventories hit a record high of 535 million barrels at the end of March. Several consecutive weeks of drawdowns in April and May again raised hopes that the market is heading towards balance. The most recent data release on May 10 showed crude inventories fell again by 5.25 million barrels to 522.5 million.
At the same time data once again showed growth in U.S. oil production. Last week the industry added another 17,000 bpd, taking U.S. output up to 9.31 million barrels per day (mb/d), up more than 200,000 bpd since the beginning of March, and up more than 450,000 bpd since the start of the year. Output is now the highest since the summer of 2015, and if current trends continue, the industry could break all-time production records. At the moment the Energy Information Administration sees U.S. crude oil production averaging 9.3 million barrels per day in 2017, and almost 10.0 million bpd in 2018.
In addition, President Donald Trump signed an executive order that could open offshore areas for drilling that are currently off limits. The Department of the Interior then directed the Bureau of Ocean Energy Management (BOEM) to develop a new five-year plan for oil and gas exploration in offshore waters, and reconsider a number of regulations governing those activities.
The victory of Emmanuel Macron in the French presidential elections against far-right Marine Le Pen rendered some support to fuel prices as it raised hopes of a more stable Euro-pean economy. It also brought huge relief to European allies who had feared another populist upheaval to follow Britain’s vote to quit the EU and Donald Trump’s election as U.S. president. Macron had topped 66 percent against just under 34 percent for Le Pen. His immediate challenge now will be to secure a majority in next month’s parliamentary election.
China’s oil imports dropped from a record as purchases by the country’s independent re-finers were seen slowing. China, which overtook the U.S. during the first quarter as the world’s biggest importer, imported average 8.4 million barrels a day in April, down 8.8 percent from a record the previous month. Net exports of oil products also fell almost 49 percent from March to 1.01 million tons. The import decline was due to seasonal refining maintenance picking up and independent processors reaching their buying quotas. At the same time it is expected China’s crude imports will still stay at a relatively high level anyway, mostly because of China’s rather weak domestic output and strong fuel demand.
All in all, fears that oil and fuel indexes could plunge further if no extension is agreed, are putting pressure on OPEC to deliver an extension at their May meeting. However, a large degree of the OPEC extension has already been priced into the markets. That leaves little upside to an extension but a massive risk to the downside if OPEC fails to extend. We expect global fuel market’s volatility to be continued until OPEC meeting. Bunker prices will keep irregular changes.
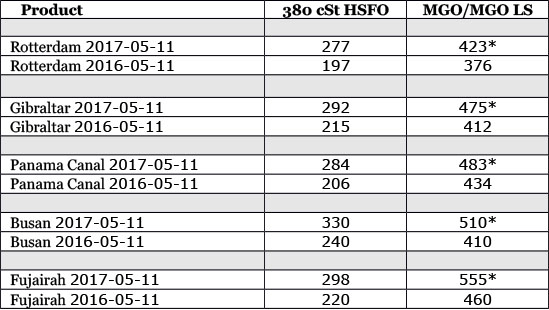
* MGO LS
All prices stated in USD / Mton
All time high Brent = $147.50 (July 11, 2008)
All time high Light crude (WTI) = $147.27 (July 11, 2008)
Source: Marine Bunker Exchange
HEADLINES
- Do shipping markets want Biden or Trump for the win?
- All 18 crew safe after fire on Japanese-owned tanker off Singapore
- Singapore launching $44m co-investment initiative for maritime tech start-ups
- Cosco debuts Global Shipping Industry Chain Cooperation Initiative
- US warns of more shipping sanctions
- China continues seaport consolidation as Dalian offer goes unconditional