Demand for Oil Key to Price Recovery…

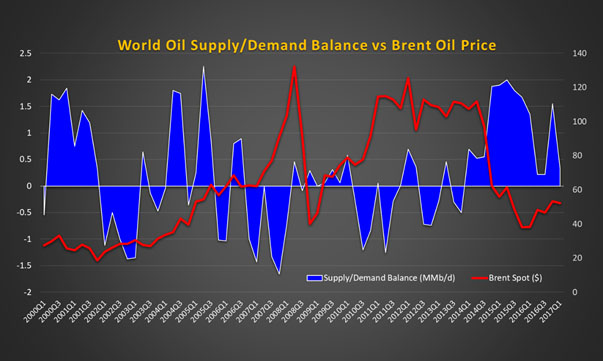
Despite the waning hype of the OPEC and non-OPEC combined (the ‘OPEC alliance’) production cuts that helped to temporarily bolster the price of oil in the short term, the fact is that supply continues to outstrip demand. The title chart (above) shows the inelastic nature of the crude oil supply and demand market. In 2016 as supply outstripped demand (and the demand curve slid to the left) the price of oil came down sharply. This year we are seeing the effects of the opposing forces of the ‘OPEC alliance’ cuts and increases in other non-OPEC production, namely U.S. Shale. If the level of supply won’t move, then the only solution left for oil price is for demand to increase. If 2018 delivers a return to increasing demand for oil, then it won’t take long before we see $100 oil again.
The Supply Demand Balance
Chart 1 below (data source: Society of Petroleum Engineers) shows the quarter by quarter difference between crude oil supply and demand (n.b. and not the total oversupply) against the Brent spot price (right scale). This chart indicates that price is being driven by the supply/demand balance (left scale). When global oil demand is greater than the available supply (i.e. the balance is negative) prices are rising or higher, and when there is an overbalance, prices are falling or lower. These price fluctuations are also exacerbated by the convenience yield effect. This effect is defined as a premium applied to the implied return on holding inventories. In futures trading markets for consumption commodities with trading constraints, users of a commodity may obtain a benefit from physically holding the asset which cannot be obtained from holding the futures contract. This includes the benefit of profiting from shortages by rapidly increasing prices, or in the ability to keep a production process running (in this case a refinery). In short, when demand is greater than the available supply, prices can quickly escalate because the ‘need’ for the commodity becomes acute if refineries start to run short of oil, or gas stations start to run short of gasoline. The actions of the ‘OPEC alliance’ to increase prices through cutting production will therefore only achieve the desired effect if supply (and the current over-supply glut in storage) can be reined in enough to allow demand to catch up.
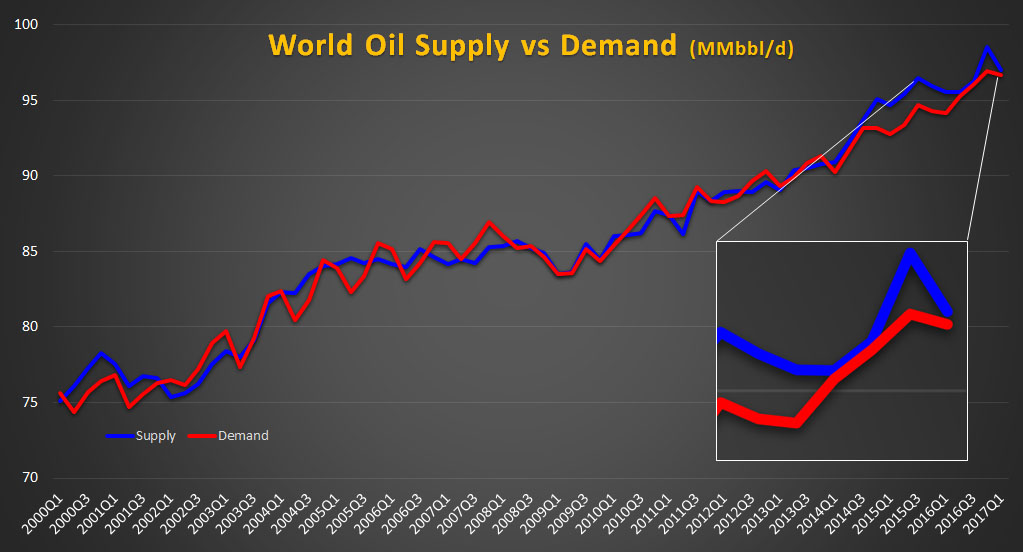
This supply/demand relationship is a finely balanced act for markets to maintain, as shown in Chart 2 below (data source: EIA). This shows that the power of economic forces ensures that supply and demand remain closely coupled together. When there is oversupply, the price will tend to fall which will discourage new supply from coming to the market until demand has recovered and has pushed prices higher. (Scale: MMb/d)
Oil Producers Deliver Cuts, Oil Markets Deliver Nothing
Why aren’t the “OPEC alliance’ production cuts having the desired effect? A recent report out by oil trader Vitol Group is suggesting that the reason for this is because U.S. Shale output is growing faster than production cuts elsewhere, and that this is only increasing the burden on the ‘OPEC alliance’ to stick to their pledges to cut supply just to keep prices from falling. Bloomberg also looked at the effects of the productions cuts on prices recently (“Oil Producers Deliver Cuts. Oil Markets Deliver Nothing” April 20, 2017), and commented that the [‘OPEC alliance’] group will have to decide later this month whether to “extend productions cuts that haven’t really lifted prices, or return to pump-at-will policies that caused the crash”.
Meanwhile, world oil demand continues to be sluggish, and must find new legs before much needed investment in new exploration and production will take place. The U.S. appears to be flying in the face of conventional market wisdom though, and with ExxonMobil, Chevron and others reporting strong first quarter earnings, it is clear that producers have learned to curtail costs in the new reality while protecting profits. Although it’s by no means a bed of roses for all. Those E&P companies that have turned up late to the Permian basin ‘party’, and those that remain heavily over-leveraged continue to struggle to pay down debt and meet covenants. Production data indicates that the resurgence in U.S drilling does indeed appear to be weighing against a global oil price recovery.
Crude Oil Consumption on the Rise…or is it?
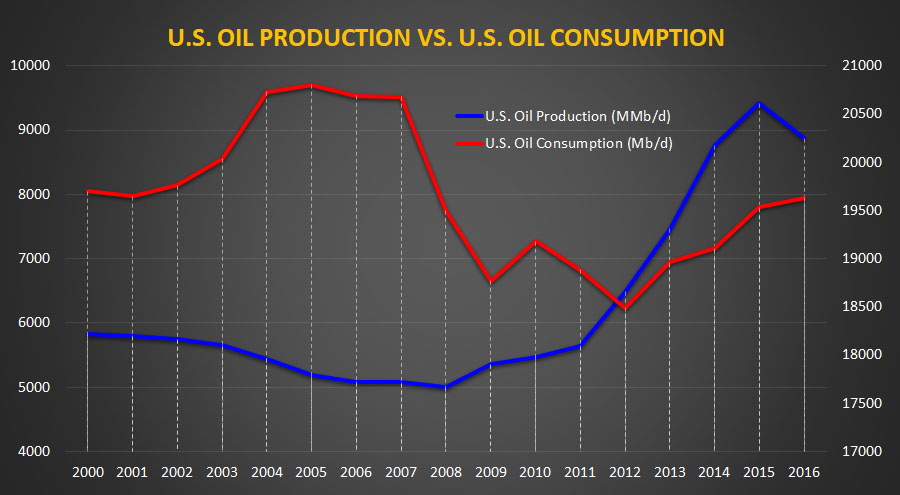
The total U.S. oil production figures versus total U.S. oil consumption is shown in Chart 3 above (data source: EIA). Since the financial crisis on 2008 until mid-2012 consumption (right scale) was generally falling before beginning to rise steadily until today. Total U.S. production (left scale) has also continued to increase steadily since 2008. And although there was an appreciable drop in production in 2016, EIA reports indicate that U.S. production is on the rise again. It is also interesting to note that the level of consumption today is lower than it was in 1997, despite the fact that the economy has grown by 50% over this period. So the continuing rise in U.S. production may be reducing the need for imports, which in turn will also reduce overall global demand for oil. Reconciling the consumption data to the growth in U.S. population adds an extra dimension to the supply/demand picture. Since 2000 the U.S. population has grown from 282 million, to 323 million, where it stands today (U.S. Census Bureau). Chart 4 below shows that U.S. oil consumption per person is flat and may even be in decline.
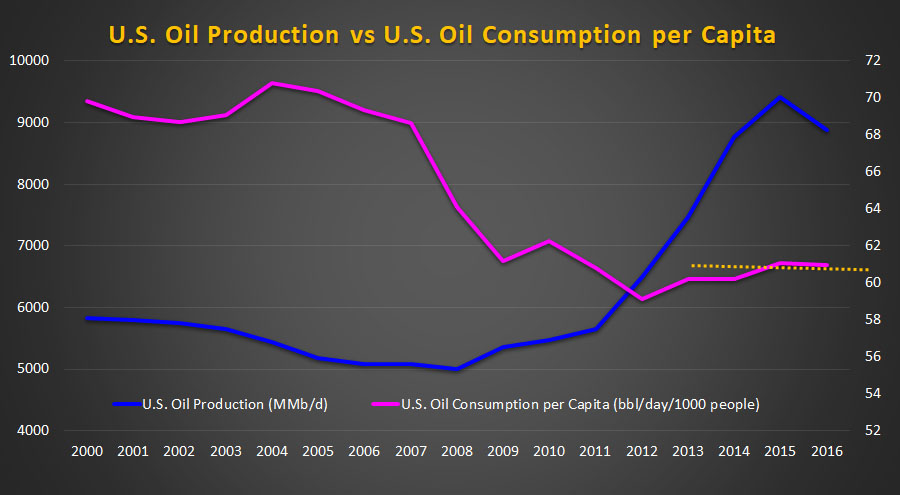
So, when the consumption rate is calibrated to the number of people doing the consuming, not only has oil consumption per capita fallen dramatically since 2000, it is beginning to look less likely that demand for oil in the U.S. will have an appreciable impact on oil price, or on the consumption of the growth in U.S. supply. At the same time, the rate of annual population growth in the U.S. has been in general decline since the 1980’s, and has fallen from 1% or so per year in 2000 to only 0.69% per year today (U.S. Census Bureau).
Transportation Fuel Consumption
Crude oil is of course not a finished good, and requires further refining into products that can be consumed by people The U.S. energy use profile, and the consumption of derivative oil products must therefore also be a part of the fundamentals behind oil price dynamics.
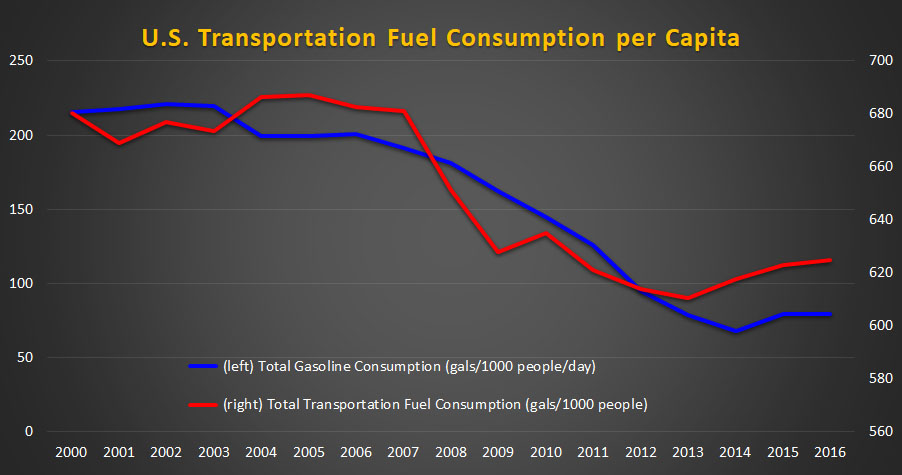
Chart 5 above (data source EIA, and U.S. Bureau of Transportation Statistics) shows that gasoline consumption per person has been falling since 2007 (blue line), and this is due to two things; the significant increase in vehicle fuel economy that has occurred during this time, and the growth in the use of electric cars and natural gas powered vehicles (buses, trucks etc). The total transportation fuel consumption per capita (red line) also shows a similar trend, and this includes trains, planes (domestic), automobiles, buses, boats, haulage etc. Since total gasoline consumption is flat and total transportation fuel use per person has begun to rise again since 2013, this also suggests that the efficiency gains with gasoline powered cars and trucks, and with electric vehicles, has not yet been fully translated into the heavier forms of transportation. There are simply more people and goods traveling further on less fuel per person than ever before.
Crude Oil Oversupply Pushed Along the Supply Chain
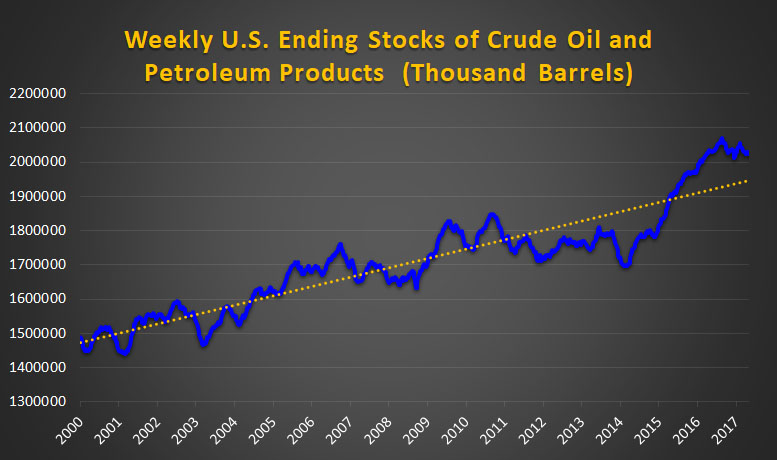
Chart 6 above (data source: EIA – excludes SPR) shows that even though U.S. consumption has been increasing with population growth, it is not enough to prevent the long term growth in petroleum stocks, which continue at record levels. Some relief looks like it is on the way as the short term trend is flat or down, but it is still above the trendline for the average growth rate of storage. This indicates that even though the markets watch the crude oil storage figures closely, even in weeks when crude storage is flat stockpiles are moving further downstream faster than consumption rates. This weeks’ rise in the price of crude futures, after the latest EIA inventory report (May 10th, 2017) may just be wishful thinking by the market.
U.S. Exports also on the Rise
Overall, this means that a global increase in demand for crude will not come from continuing growth in U.S. consumption. As the U.S. continues to increase oil production this oil will have to go somewhere and this means increased exports of crude, especially now that the 15-year moratorium on crude oil exports has been lifted.
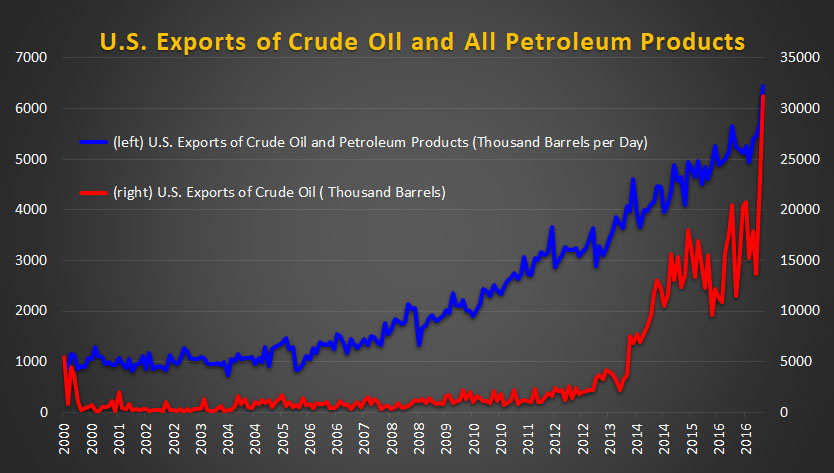
Chart 7 above (data source: EIA) shows that a never-before-seen level of 31 million barrels of U.S. crude were exported in February 2017, mostly to Canada, China, Europe, and Asia. This is the challenge that has caused OPEC to increase it’s forecast of non-OPEC production in their latest monthly report (May 11th, 2017). Bear in mind that this chart has been scaled for illustration purposes. The reality is that the U.S. is exporting 180 million barrels or more of petroleum products per month versus only 31 million barrels of crude, a ratio of roughly 5:1. Further increases in U.S. production will head straight for export since refineries continue to be at or near capacity, and heavier oil must be imported in order to mix it with the lighter U.S. Shale crudes for optimum refining performance.
Imports Tracking Refined Products
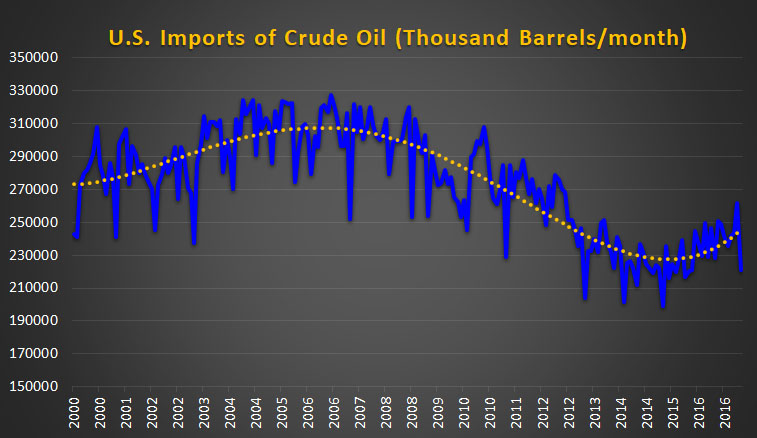
U.S. imports of foreign crude oil did fall from a peak in 2006 prior to the effects of the shale revolution kicked in and began replacing equivalent imports. Imports then began to fall through the period until 2015, when further refining capacity began to demand a larger volume of heavier crudes. Chart 8 below (data source: EIA) shows that the U.S. continues to import in the region of 250 million barrels of crude oil per month, with 40% of it coming from OPEC, and the remainder coming from Canada, Columbia, Mexico, and Russia. This makes the global supply/demand balance that sets the price of crude oil equally a political as well as an economic challenge. Quick math also says that 250 million barrels coming in and 210 million barrels going out means that the U.S. is perhaps not as far away from [oil] energy independence as many might think. This equates to 40 million or so barrels a month or around 1.3 million barrels a day of a difference. At a macro-level it makes perfect sense from a value added perspective for the U.S. to keep increasing imports of foreign heavy oil to mix with the lighter shale oil until the refineries are fully utilized. Exports of finished petroleum products are far more profitable than crude, and this adds to the economy and helps to reduce trade deficits.
Lower for Even Longer?
In summary, significant growth in demand is not going to come from the U.S. any time soon. A similar set of arguments exists for the developed countries of Europe, who are also challenged with aging populations, declining population growth, and significantly faster growth in alternative energy sources than we see in the U.S. The bellwether for the recovery the oil price is going to come from growth in demand from India and Asia, while the Chinese economy needs to continue to grow apace without falter. Not a lot is currently published about the Africa nations as a group of energy users, and they may be better candidates in the future for continued growth in the LNG export market.
Source: Chris Chia
HEADLINES
- Dual-Fuel Fleet Surges to 400 Ships as Alternative-Fuel Investment Defies Market Slowdown
- Do shipping markets want Biden or Trump for the win?
- All 18 crew safe after fire on Japanese-owned tanker off Singapore
- Singapore launching $44m co-investment initiative for maritime tech start-ups
- Cosco debuts Global Shipping Industry Chain Cooperation Initiative
- US warns of more shipping sanctions