Shock And Bore: Tracking Tight Oil’s Price Dynamics
A few weeks ago, OPEC and other major oil producers agreed to extend 1.73m bpd of production cuts until the end of Q1 2018. Despite this, oil prices have continued to slide, with Brent failing to close above $50/bbl this week. While a range of factors have contributed to this trend, perhaps the most important is US tight oil production. So what is going on in the shale patch? And why does it matter to shipping?
How Unconventional!
If nothing else, US tight oil production retains the ability to surprise. As was noted after the OPEC meeting in May (SIW 1,273), “it remains to be seen if shale production quickly offsets” the cuts. Well, if the early signs are anything to go by, this is clearly not an impossibility.
Tight or shale oil is oil extracted from otherwise almost impermeable geology via “fracking”, a process wherein fluids mixed with sands are pumped at pressure into well bores, creating fractures in the rock through which oil and gas can flow. In terms of oil price dynamics, the key aspect of shale projects is speed: they can have lead times measured in weeks and so are very responsive to changes in oil prices. But in turn, as tight oil production ramps up, it can put pressure on prices, as recent history shows.
Remarkable Resilience
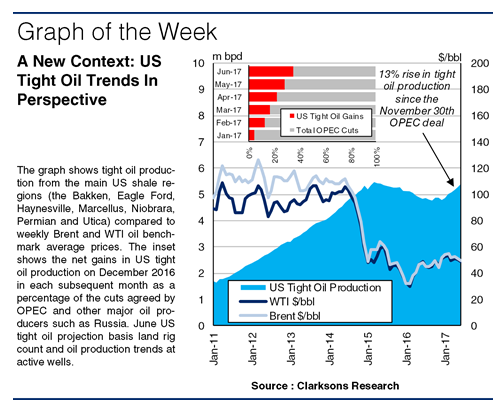
The US tight oil sector really took off in 2011, with production more than tripling from 1.70m bpd to reach a peak of 5.47m bpd in March 2015, as the graph shows. At this point, tight oil accounted for 6% of global oil supply (96m bpd) and equated to 55% of the net growth in supply from 2011. Such rapid supply growth had not been priced into markets, a key factor in the 2014 oil price plunge. A partial revival in mid-2015 was smothered as US drilling was stimulated again. And, since the US land rig count hit a new low of 380 units in May 2016, activity has again been on the up; the November 2016 OPEC deal accelerated this and the land rig count now stands at over 900 units. Tight oil production growth now equates to around 35% of the OPEC cuts. Its resilience (via cost deflation) in the face of lower oil prices continues, it seems, though it may prove self-defeating yet again. Even so, tight oil could now be a long term part of the oil price context. A few years ago, forecasters saw US tight oil production peaking circa 2020. Revised projections taking into account new technologies and updated resource surveys do not see US tight oil output peaking before the 2030s.
More Surprises?
The negative and positive implications for shipping of higher oil prices were covered in detail previously (SIW 1,273). The converse applies to lower oil prices, with offshore suffering from reduced E&P activity but the merchant fleet perhaps seeing benefits from cheaper bunkers and crude oil trade growth. Tight oil also has implications for trade flows. For example, now that export restrictions have been lifted, around 0.7m bpd of crude oil was exported from the US via tankers in Q1 2017.
So a factor that was barely on the radar a decade ago has become a key determinant of oil prices, potentially for the long haul. Moreover, tight oil has a range of ramifications for shipping that merit close monitoring. Once again, shipping appears inextricably linked to a key facet of the global economy. Have a nice day.
Source: Clarksons
HEADLINES
- Reversal! HMM Union Drops Opposition, Headquarters Relocation to Busan Confirmed
- Five Major Shipping Lines Have Over 30 Vessels Trapped in the Strait of Hormuz
- COSCO SHIPPING Holdings Achieves RMB 5.877 Billion in Net Profit Attributable to Parent Company in Q1 2026
- VLCC Idle Rate Climbs to 55%! Tanker Owners Grapple with Scarcity of Physical Cargoes
- COSCO SHIPPING Energy: Acquires 100% Equity of Dalian Investment; Q1 Net Profit Soars by 206.7%
- China's largest domestically built LNG carrier delivered