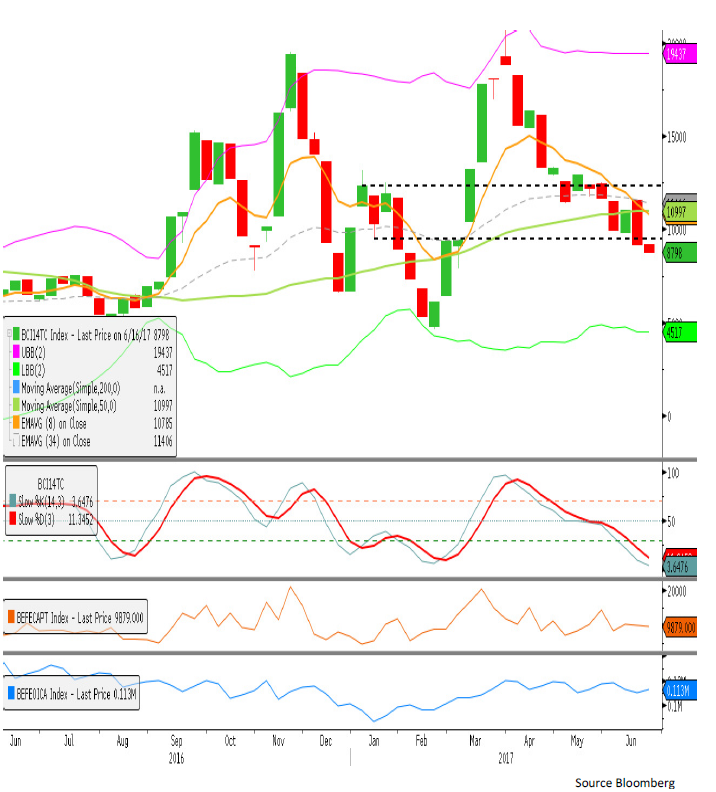
Dry Bulk FFA: Capesize Index Is Now Below The Support Zone
Capesize Index
Resistance – 9,837 11,577, 12,345, 12,944
Support – 7,893, 6,570, 4,630
The intraweek upward move in the Capesize index briefly broke the USD 11,484 resistance level, the technical hotspot highlighted last week. However price action failed to hold above this level, resulting in a break below the support zone. The trend remains technically bearish as it continues to make lower highs and lower lows.
The stochastic is now oversold on the weekly chart, with the daily chart is showing a bullish divergence. The next technical support is at USD 7,893 which is USD 900 away, and the next logical downside target. Price rejection off the USD 7,893 support should result in a near term upswing. Market shorts should look to tighten risk if the daily chart starts to create higher highs, as this would signal to technical buyers that the trend is either entering into a consolidation phase, or into a transition from bearish to bullish. Technically bearish, market buyers should wait for higher lows on the daily chart for early entry signals.
Capesize Q3 17 Daily
Support – 11,620 11,400, 11,124, 10,351
Resistance – 14,157, 14,694, 15,587, 15,643
In the last report we highlighted the Cape Q3 was mid-range, with better trading opportunities coming from a rejection of the USD 14,100 area. Upside price action topped out at around USD 13,850 area, and has resulted in price action looking to test the support zone between USD 11,620 – USD 11,400. The stochastic is now showing a bullish divergence which should add weight to the current support zone. Failure to make a new low below USD 11,620 would create a higher low, and should attract technical buying interest. A new low close would keep the trend within bearish conditions, technically oversold, suggesting market shorts could find better entry levels around the USD 13,100 level.

Capesize v Panamax Q3 17 Spread
Support – 2,735, 2,525, 2,165
Resistance – 4,243, 5,000 5,837 The higher low in the Capesize v Panamax Q3 17 Spread failed to reach the USD 5,837 resistance level, and only achieved a high of USD 5,276. The spread now oversold and entering a support zone between USD 3,360 and USD 2,165, with interim support at USD 2,735 and USD 2,525. Technical resistance starts at USD 4,243, upside moves that fail around this level would suggest downside continuation. Technically oversold but within a bearish trend, the spread has the potential to mean revert back to the resistance around USD 4,243. Near term market shorts should now be looking to tighten risk.

Capesize Q3 v Cal 18 Daily
Support – (907), (-1,046), (-1,282)
Resistance– (-15), 294, 782
A whipsaw last week saw the resistance zone briefly broken. However, prices failed to penetrate the USD 975 resistance. A subsequent close below the resistance zone has resulted in the near term support being broken, with prices now around the USD – 800 area. The spread is nearing the USD – 907 support and the stochastic is showing a bullish divergence, suggesting downside momentum could slow down in the near term. Technically bearish, the bullish divergence with the stochastic would suggest that we could see a mean reversal from support, targeting the technical resistance around USD – 15.

Source: Freight Investor Services (FIS)
HEADLINES
- Reversal! HMM Union Drops Opposition, Headquarters Relocation to Busan Confirmed
- Five Major Shipping Lines Have Over 30 Vessels Trapped in the Strait of Hormuz
- COSCO SHIPPING Holdings Achieves RMB 5.877 Billion in Net Profit Attributable to Parent Company in Q1 2026
- VLCC Idle Rate Climbs to 55%! Tanker Owners Grapple with Scarcity of Physical Cargoes
- COSCO SHIPPING Energy: Acquires 100% Equity of Dalian Investment; Q1 Net Profit Soars by 206.7%
- China's largest domestically built LNG carrier delivered