Dry Bulk FFA: Supramax Index Firming Up
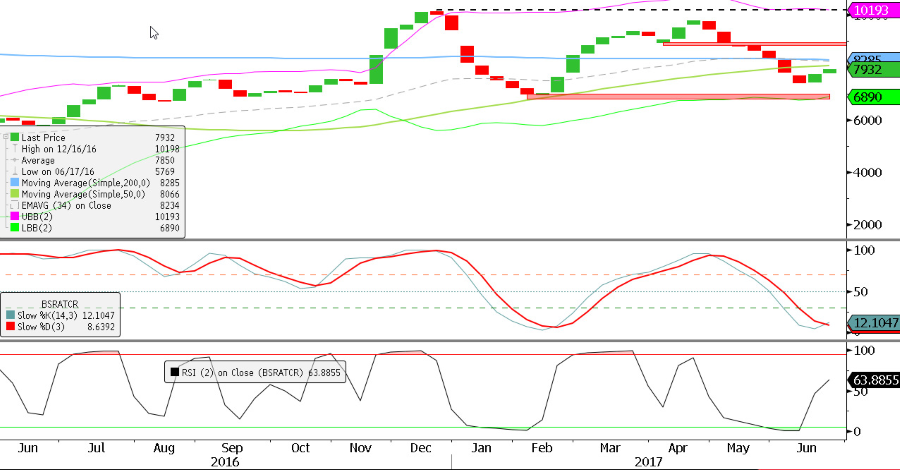
Supramax Index Weekly
Support –6,934, 6,680, 5,769
Resistance – 8,950, 9,794, 10,034
The Supramax index remains in its technical support zone with pricing in the middle of the range.
The lower high and higher low would suggest that the index is now in a consolidation period, with market pricing back off its recent lows.
The weekly stochastic at 8 is now oversold, however this does not constitute a buy signal in its own right, and market buyers looking for technical entry should now be looking to the daily chart for technical entry in the form of a higher low.
Upward moves on the weekly chart that fail at the USD 8,950 resistance should attract sellers looking to test the USD 6,934 support level.
We now have daily support at USD 7,412, any pullback in price on the daily chart that fails to close below this level would attract early entry buyer’s targeting the upper range resistance at USD 8,950.
Source: Bloomberg
Supramax Q3 17 Daily
Support –, 8,310, 7,357
Resistance– 9,215, 9,500, 9,920
Support has held in the Q3 futures, and the technical resistance has been broken.
Momentum has now gone from oversold to overbought, with resistance now at USD 9,215 and USD 9,500. If the futures pull back and hold above the USD 8,310 support it will produce a potential inverse head and shoulder. Unusual as it will be facing a head and shoulders top. This scenario would attract technical fresh buyers to the market looking for early entry.
The trend is now bullish and technical sellers should wait for either a lower high to form after a market pullback, or a rejection of resistance, though this would be a counter trend play and carries higher risk.

Supramax Cal 18 Daily
Support –, 8,495, 8,070, 7,800
Resistance – 8,940, 9150, 9,600
The 200 period MA support held last week resulting in the technical resistance being tested, and broken.
Market buyers that did not enter longs on the support should now be looking for a pullback in price that above USD 8,390 level, as this is the 50% retracement from the recent high/low. Below this level, although technically bullish would be considered as higher risk.
Momentum is overbought, however this does not constitute a sell without price rejection from a technical resistance level. Market sellers should act with caution due to the strength of the last upward move as it would suggest that sentiment has now changed.
Nearing resistance, the strong upward move would suggest that any pullback should be met with buying interest.

Source: Bloomberg
Supramax Q3 V Cal 18 Daily
Support – 142 (-43), (- 215)
Resistance– 380, 464, 779
A higher low formed on the 6-6-17 and this changed the dynamics of the trend. The higher low occurred whilst the stochastic were on their lows, producing a signal known as a hidden divergence.
Technically bullish, resistance levels have been broken, with the market high being the next logical target, at USD 380.
Failure at this level could attract technical sellers to the market, conservative sellers should look for a lower high first as the nature of the trend is currently bullish.
A close above USD 380 will attract fresh buyers to the market. The safer trade here is to look for a pullback to confirm that resistance is acting as support before entering, thus avoiding a false breakout.

Source: FIS
HEADLINES
- Do shipping markets want Biden or Trump for the win?
- All 18 crew safe after fire on Japanese-owned tanker off Singapore
- Singapore launching $44m co-investment initiative for maritime tech start-ups
- Cosco debuts Global Shipping Industry Chain Cooperation Initiative
- US warns of more shipping sanctions
- China continues seaport consolidation as Dalian offer goes unconditional