Dry Bulk FFA: Capesize Market Reversal Underway
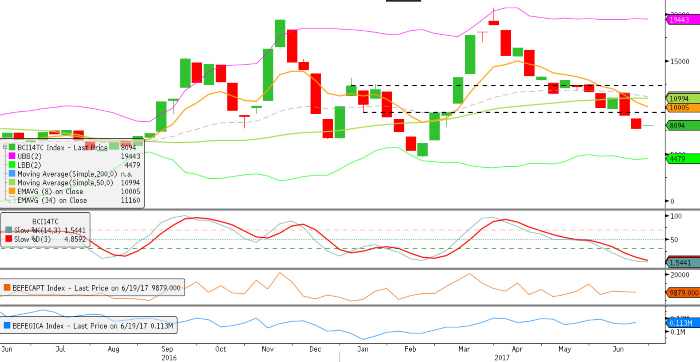
Capesize Index
Resistance – 9,837 11,577, 11,737, 12,508
Support – 7,618, 6,570, 4,630
The Capesize index is starting to mean revert back to the technical resistance at USD 9,837, or the 8 period EMA (USD 10,005)
The stochastic remains oversold, but the trend remains technically bearish, with a new low printed at USD 7,618 last week.
Upside moves that fail to close above the resistance zone USD 9,837 – USD 10,005 would suggest further downward moves, with the USD 7,618 being the most logical target.
Market buyers should continue to look to the daily chart for early entry signals in the form of a higher low (above USD 7,618) before looking to enter.
From a technical perspective the trend remains bearish, and buyers should remain on the side lines until a higher low presents itself.
Capesize Q3 17 Daily
Resistance – 13,853, 14,157, 14,694
Support – 11,620 11,400, 11,124, 10,351
In The bullish divergence last week resulted in the support holding and a higher low has now been created.
The higher low attracted technical buyers and the futures are now trading USD 900 higher. However from a technical perspective we are now mid-range, making this a dangerous area to enter the market.
Upside moves that fail at the USD 13,853 resistance would confirm that the Q3 futures are now in a consolidation phase. Rejection from this level should attract technical sellers looking for near term moves to the downside support.
Buyers that are not already long should now wait for another higher low before entering, with an upside target at the USD 13,853 technical resistance.
A higher low, but the potential to consolidate within range.

Capesize v Panamax Q3 17 Spread
Resistance – 4,243, 5,000 5,837
Support – 2,735, 2,454, 2,165
Support held last week on the Cape v Panamax Q3 spread, with prices back above the USD 3,100 level.
The stochastic remains in oversold territory, and the trend remains technically bearish. The confirmation of the support zone would suggest that there is potential to revert back to the technical resistance at USD 4,243.
There is interim resistance at USD 2,154 in the form of the 8 period EMA, however the 34 period EMA seems to have been the more respected average so far this year. Failure at the resistance would attract fresh technical sellers.
A close below USD 2,454 would suggest further downside continuation, targeting the USD 2,165 support area.
Market buyers that haven’t taken near term long positions off the support level should wait for a higher low before entering. Upside target, USD 4,243.

Capesize Q3 v Cal 18 Daily
Resistance– (-185), 294, 782
Support – (907), (-1,046), (-1,282)
The mean reversal we spoke of last week is currently underway. Support held on the bullish divergence and we have now seen a USD 500 plus rally in the spread.
The stochastic on the daily chart is oversold, however the recent low was a fresh low, and keeps the trend bearish. For this reason we are still looking for a mean reversal, rather than a market bottom.
Technical resistance can be found at USD – 185 and USD
294. A failure at the first resistance would suggest further downside pricing, with the recent low at USD – 839 being the next logical target.
Downside moves that fail to close below the USD – 839 level would create a higher low and should attract technical buyers into the market, targeting USD 294.

Source: FIS
HEADLINES
- Reversal! HMM Union Drops Opposition, Headquarters Relocation to Busan Confirmed
- Five Major Shipping Lines Have Over 30 Vessels Trapped in the Strait of Hormuz
- COSCO SHIPPING Holdings Achieves RMB 5.877 Billion in Net Profit Attributable to Parent Company in Q1 2026
- VLCC Idle Rate Climbs to 55%! Tanker Owners Grapple with Scarcity of Physical Cargoes
- COSCO SHIPPING Energy: Acquires 100% Equity of Dalian Investment; Q1 Net Profit Soars by 206.7%
- China's largest domestically built LNG carrier delivered