European Products Imports: A Change Of Pace?
Europe is a major importer of oil products, accounting for over 30% of global seaborne products imports last year. Following the oil price crash, European imports rose from 6.7m bpd in 2014 to 7.2m bpd in 2016, accounting for around a quarter of growth in global products trade in this period. However, the rate of growth in imports has slowed significantly since mid-2016. What has driven the change of gear?
Stepping On The Gas
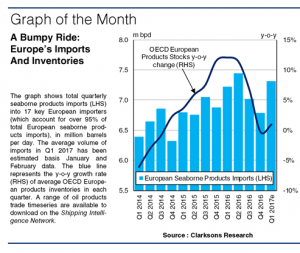
The oil price crash in 2H 2014 led to a notable shift in products trade patterns in Europe. In 2015, refinery margins in Europe improved, supporting an increase in OECD European refinery throughput of 6% in the full year. This resulted in greater availability of oil products in Europe, whilst the low oil price environment in 2015 led to the first rise in oil demand in OECD Europe in eight years. These two factors boosted growth in intra-European products trade, which accounts for over 70% of European imports. As a result, European seaborne products imports grew 4.4% in 2015 to 7.0m bpd. Meanwhile, OECD European products stocks, which had been declining in early 2014, surged 7% over 2015 due to a building surplus of oil products in the region.
Hitting The Brakes
In 1H 2016, European seaborne products imports saw continued strong growth of 8% y-o-y. Weaker refinery margins in the region relative to the previous year reduced refinery throughput by 3% y-o-y, limiting intra-European products trade. However, there was still firm growth in oil demand in the region, aided by the further fall in oil prices, and in order to meet this demand, products imports from non-European countries, particularly India and Middle Eastern nations, rose robustly. Meanwhile, by July 2016, OECD European products stocks had hit 593m bbls, up 13% y-o-y, and subsequently were drawn down in the rest of the year, falling to 562m bbls in December, down slightly y-o-y. In line with this slowdown in stockbuilding, European seaborne products imports declined by 1% y-o-y in 2H 2016, slowing the overall rate of growth in imports in full year 2016 to just 3.3%.
What’s Round The Bend?
Looking to 2017, there are a range of scenarios for the trajectory of European seaborne products imports. Product stocks in the region have returned to high levels, reaching 597m bbls in January, suggesting the likelihood of further inventory draws and a slower pace of growth in European seaborne products imports in 2017. Initial data indicates that European seaborne products imports have continued to grow slowly, rising by 1% y-o-y in the first two months of 2017. However, another significant drop in oil prices could renew stronger growth in refinery throughput and European products trade.
So, there have been several shifts in European products trade dynamics over the past two years, prompted by significant changes in oil prices and inventories. With OECD European products stocks having hit a seven year high this year, growth in European seaborne products imports appears likely to slow compared to previous years. However, whatever the outcome, given its significance on the global products stage, Europe is likely to be an important factor affecting growth in global products trade this year.
Source: Clarkson Research Services Limited
HEADLINES
- Reversal! HMM Union Drops Opposition, Headquarters Relocation to Busan Confirmed
- Five Major Shipping Lines Have Over 30 Vessels Trapped in the Strait of Hormuz
- COSCO SHIPPING Holdings Achieves RMB 5.877 Billion in Net Profit Attributable to Parent Company in Q1 2026
- VLCC Idle Rate Climbs to 55%! Tanker Owners Grapple with Scarcity of Physical Cargoes
- COSCO SHIPPING Energy: Acquires 100% Equity of Dalian Investment; Q1 Net Profit Soars by 206.7%
- China's largest domestically built LNG carrier delivered