Dry Bulk FFA: Capesize Market’s Bearish Trend Persists
Highlights:
• Capesize Index- Technically the trend remains bearish. Market buyers need to see higher lows on the daily chart before looking to enter the market.
• Q4– Technically bullish, however momentum is currently overbought.
• Cape v Panamax Q4 17 spread – Technically bearish, sellers should be cautious as the recent upward move looks more like a bull wave rather than a bearish corrective wave.
• Q4 v Cal 18 – The technical trend is bullish. The overbought stochastic could be signalling a corrective pullback rather than a genuine sell signal.
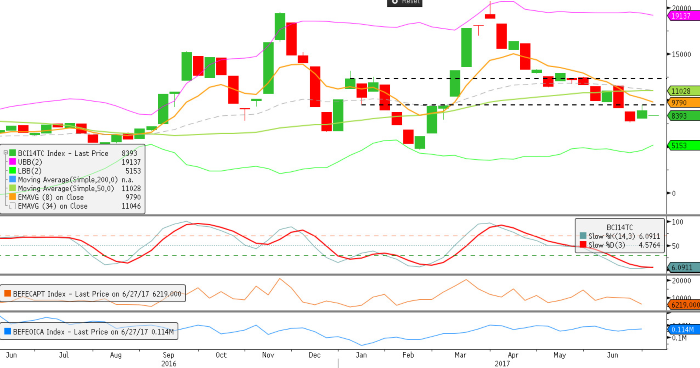
Capesize Index
Resistance – 9,489 11,577, 12,345
Support – 7,618, 6,570, 4,630
Momentum remains oversold on the weekly Capesize index with the trend still bearish.
The upside move last week failed at the low of the previous support zone, confirming it is now a resistance point. A close below USD 8,094 (last week’s low) would suggest downside continuation targeting USD 7,618 and potentially USD 6,570.
Market buyers should continue to look to the daily chart for early entry signals. Downside moves that fail to make fresh lows from here would imply either market consolidation, or be potentially bullish. A close above USD 9,489 would confirm this.
Technically the trend remains bearish. Market buyers need to see higher lows on the daily chart before looking to enter the market.
Capesize Q4 17 Daily
Resistance – 15,840, 17,090, 17,880
Support – 14,840, 14,390, 14,110
The higher high and higher low would suggest that the bias on the Q4 futures has turned bullish.
The stochastic is now overbought and showing a bearish cross, not a sell signal it is a warning of slowing momentum.
A close below the USD 14,840 support would suggest the upward move has failed.
Downside moves that hold above the USD 14,840 support would have bullish connotations going forward, and suggest trend continuation. However failure to close above USD 15,840 resistance should attract selling interest targeting the USD 14,840 support.
Technically bullish, however momentum is currently overbought.

Capesize v Panamax Q4 17 Spread
Resistance – 6,385, 6,480, 7,725
Support – 5,100, 4,805, 4,625
The upside move in the Q4 spread failed to break above the 50 period moving average on an overbought stochastic.
The major highs and lows on the spread would suggest that the trend currently remains bearish. The overbought stochastic would support this.
Market sellers should be a little cautious as the strength of the last upward move would indicate an underlying bull appetite is entering the market.
Downside moves that fail to close below USD 5,100 would suggest the trend bias is turning bullish with an upside target of USD 6,385 or higher.
Technically bearish, sellers should be cautious as the recent upward move looks more like a bull wave rather than a bearish corrective wave.

Capesize Q4 v Cal 18 Daily
Resistance – 2,820, 3,000, 3,300
Support – 2,440, 2,254, 2,016, 1,810
We are now seeing bullish price action on the Q4 Cal 18 spread, which is above the 50 period MA, and making higher highs and higher lows.
The stochastic is overbought which indicates that upside momentum is slowing, however this does not constitute a sell as it could just be a corrective wave within an upward move.
Downside moves that hold above the USD 2,440 support (50 and 200 period MA), would suggest that technical resistance at USD 2,820 should be broken. A close below the USD 2,254 support would imply the trend bias is turning bearish.
Technical sellers at this point would be looking for a lower high to enter the market.
Upside moves that fail to break technical resistance would result in a lower high and could attract market sellers.

Source: FIS
HEADLINES
- Reversal! HMM Union Drops Opposition, Headquarters Relocation to Busan Confirmed
- Five Major Shipping Lines Have Over 30 Vessels Trapped in the Strait of Hormuz
- COSCO SHIPPING Holdings Achieves RMB 5.877 Billion in Net Profit Attributable to Parent Company in Q1 2026
- VLCC Idle Rate Climbs to 55%! Tanker Owners Grapple with Scarcity of Physical Cargoes
- COSCO SHIPPING Energy: Acquires 100% Equity of Dalian Investment; Q1 Net Profit Soars by 206.7%
- China's largest domestically built LNG carrier delivered