VesselsValue市场月报 | 8月
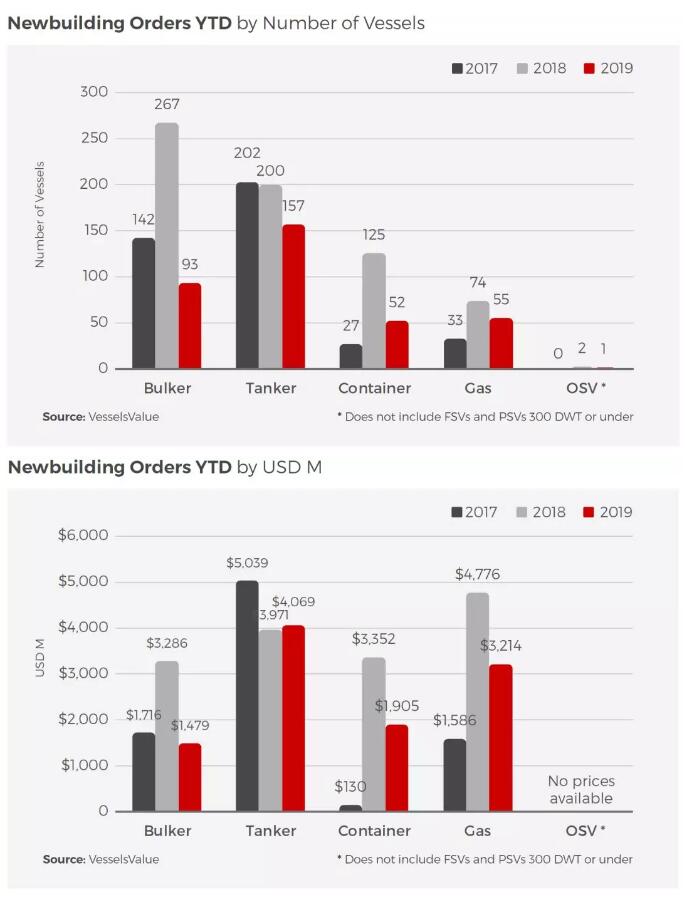
NEWBUILDING ACTIVITY
Tankers have been the flavour of the month with Sinokor ordering 10x LNG fueled Aframaxes and Dubai based Onex DMCC ordering 3x LR2s. We have also seen a surge in LPG orders with a number of smaller tonnage units being ordered.
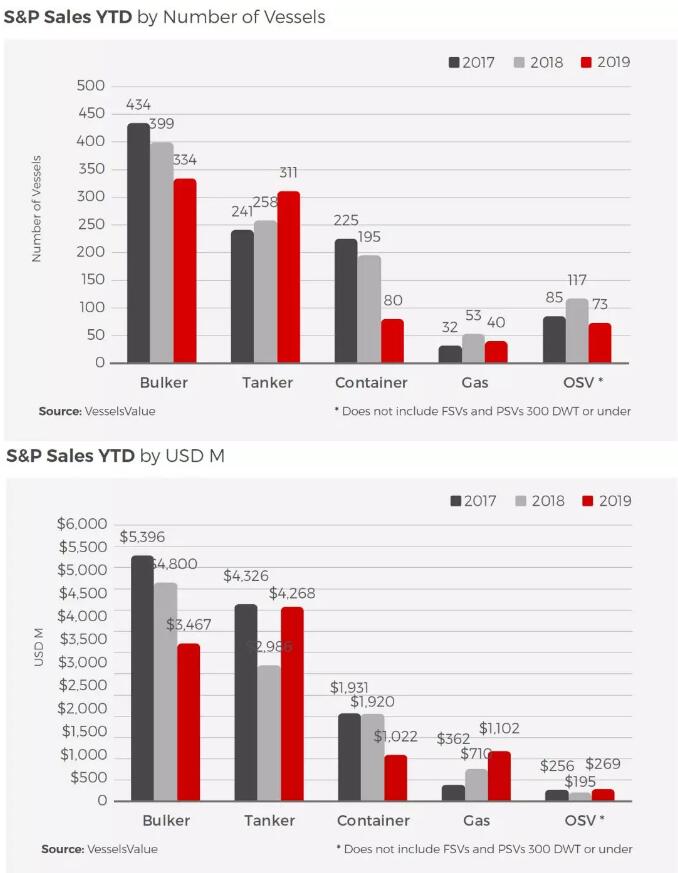
S&P ACTIVITY
Tankers continue to be dominant in the second hand S&P sector, rapidly overtaking the figures of the last 3 years. Interest has developed particularly for Handy Tankers with nearly 50% of the deals confirmed in August being MRs.
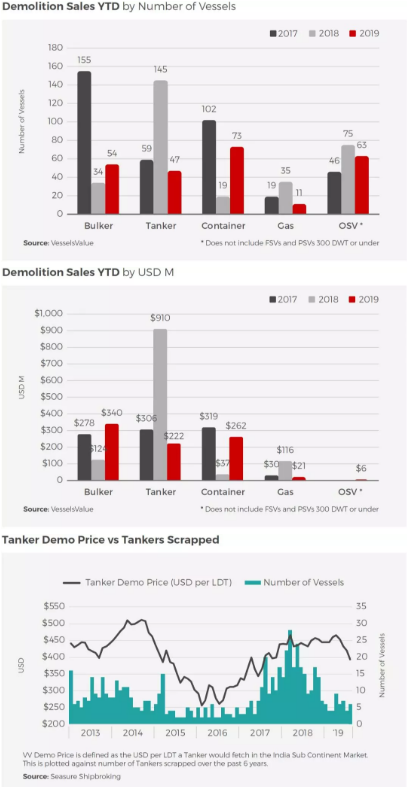
DEMOLITION ACTIVITY
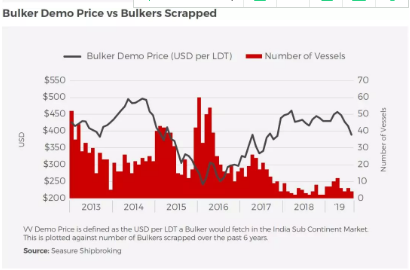
The demolition market is still enduring tough times with scrap prices continuing to fall through August. India has suffered the most with the local steel prices moving to figures not seen in the market for over 2 years.
SUPPLY & DEMAND
We offer Trade data for the Tanker, Bulker, LNG and LPG sectors.
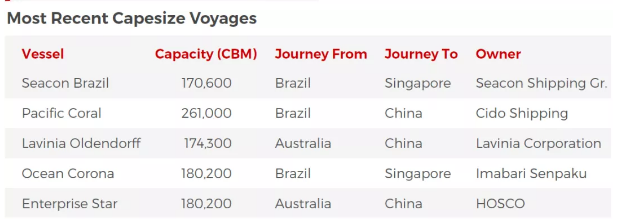
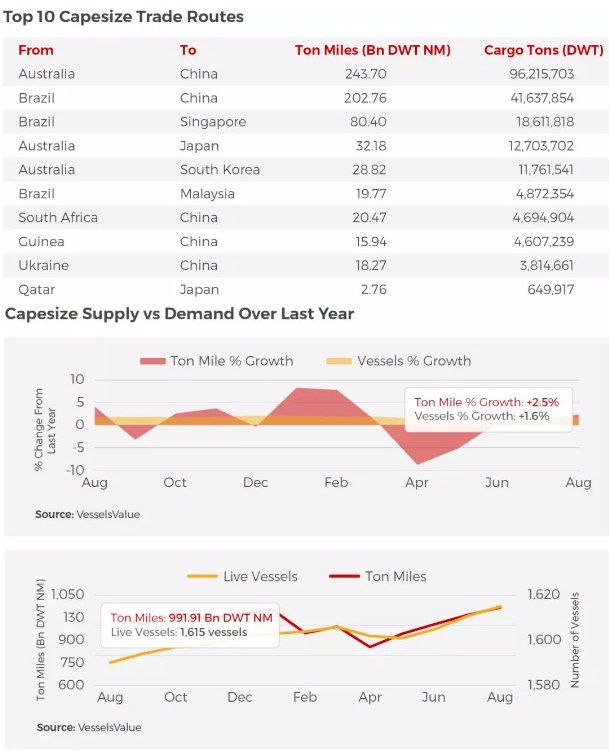
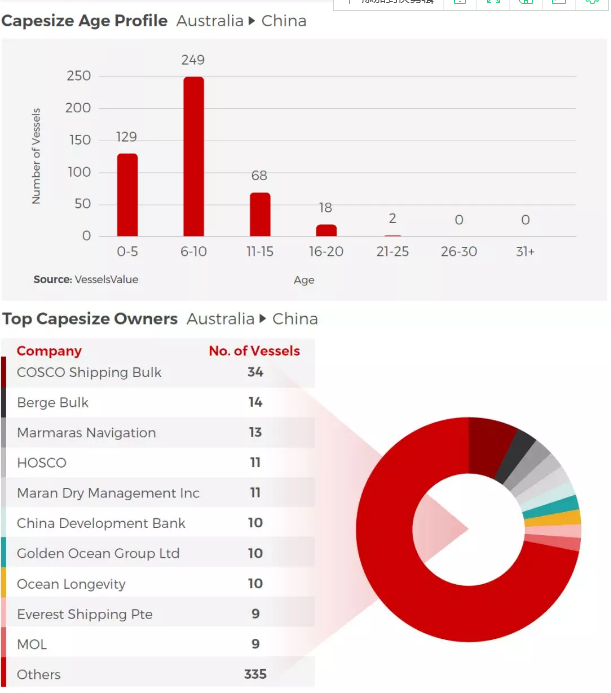
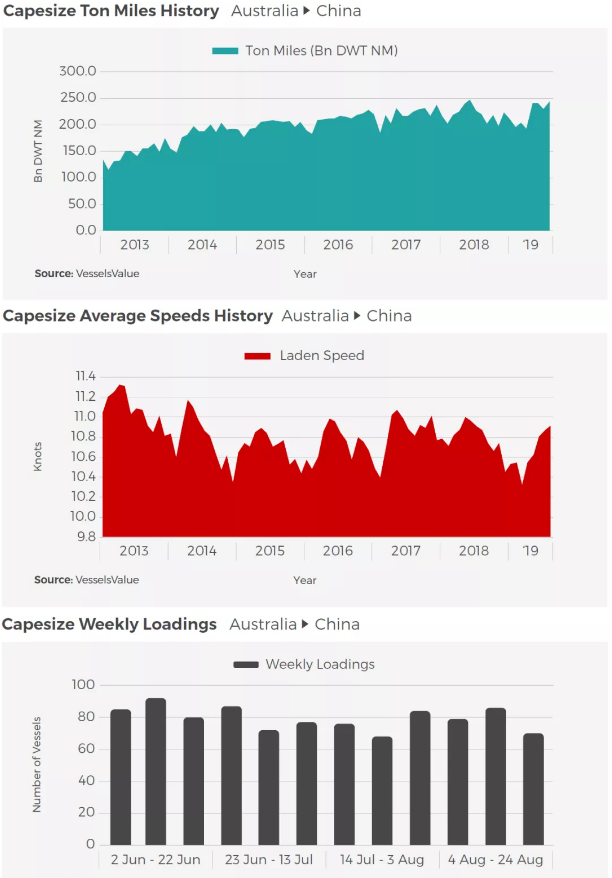
Capesize charter rates have recently hit a 9 year high after recent significant increases in ton mile demand for Capesize vessels combined with limited fleet growth. Capesize ton miles had declined from the start of 2019, mostly due to lack of volumes out of Brazil related to the port issues experienced there. Ton miles fell to their recent historical low in Apr 2019 but have since staged a recovery and are now above their Dec 2018 level (the previous historical high). This can be clearly seen in the Demand Supply Balance chart below which is derived from our real time analysis of every Capesize ballast and laden journey over the relevant periods.
OFFSHORE UTILISATION
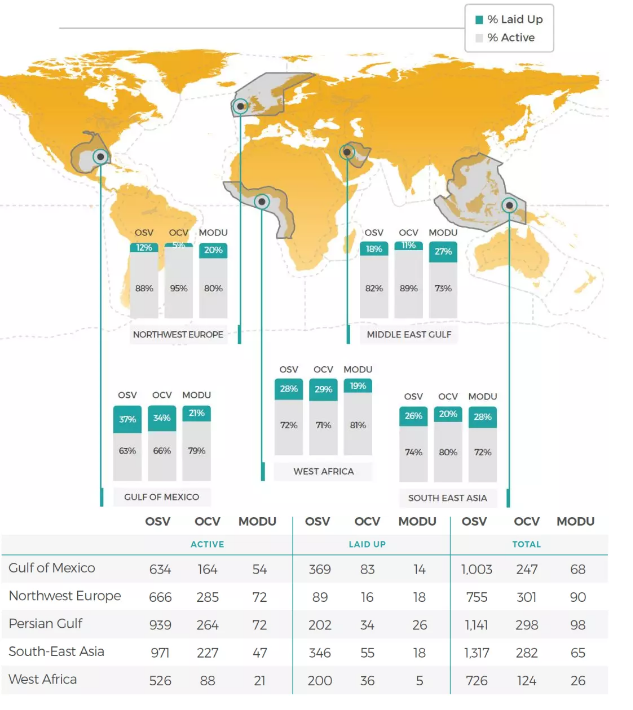
Regional Offshore Lay Ups
Percentage of vessels laid up in each region by ship type
OFFSHORE FLEET
DEVELOPMENT
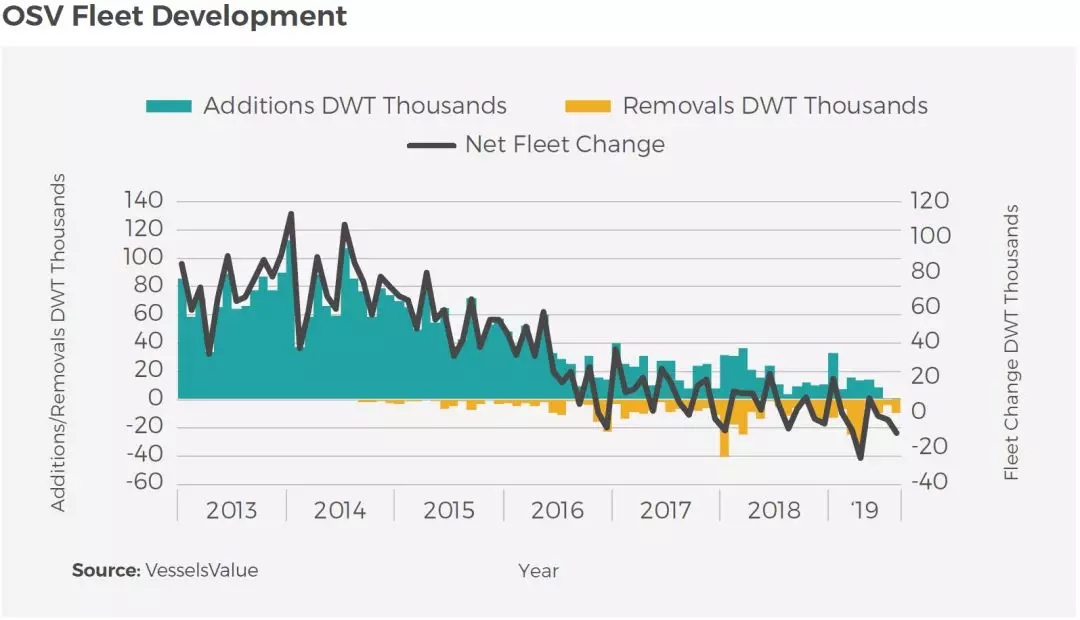
Offshore fleet development continues to fall with no new additions to the fleet and a small number of demolition sales in August.
VALUE ANALYSIS
Bulkers
Capesize spot rates have enjoyed a strong couple of months, however this has not been translated into the concluded deals. At the end of August, Japanese owners called for offers on the Australia Maru (181,400 DWT, Sep 2012, Koyo Dock) and the best seen was USD 26 mil, this resulted in the vessel being withdrawn from the market.
Panamax, Ultramax and Supramaxes have proven a popular choice with 25 vessels sold during the month of August and a total price of over USD 300 mil.
This table shows the monthly % change in value from 1st to the 31st August 2019 for Bulker vessels, by year of build.
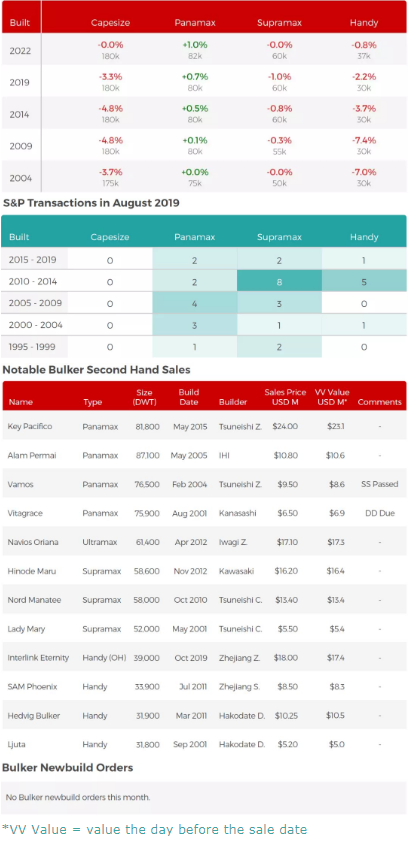
*VV Value = value the day before the sale date
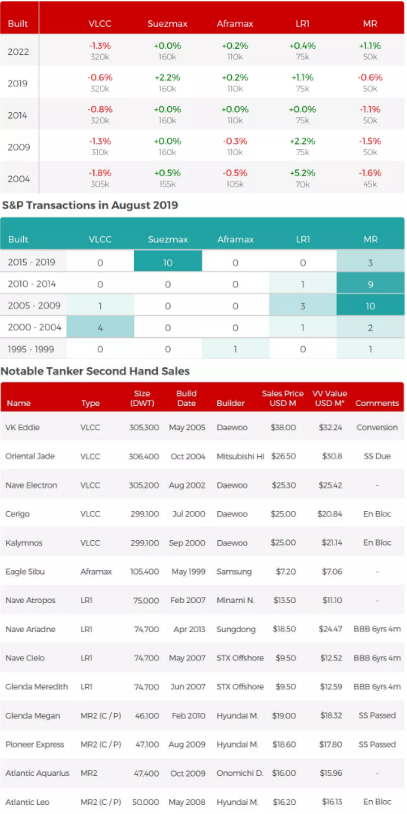
The main story this August has been the volume of Suezmax tankers changing hands. Frontline recently announced acquisition of 10 Hyundai built, scrubber fitted resales from Trafigura Maritime, with an option to purchase 4 more built at New Times, China. The deal includes USD 538-547 mil worth of cash funded by Hemen Holding, 16 mil of shares at a price of USD 8 per share. Once concluded, the deal will take the number of Suezmaxes in Frederiksons fleet to 28, just behind Teekay and Dynacom.
Older VLCCs have also proven popular. A handful of vessels have been sold to both new entrants looking to capitalise on momentum caused by an uplift in spot rates and to conversion buyers who have specific projects in mind.
This table shows the monthly % change in value from 1st to the 31st August 2019 for Tanker vessels, by year of build.

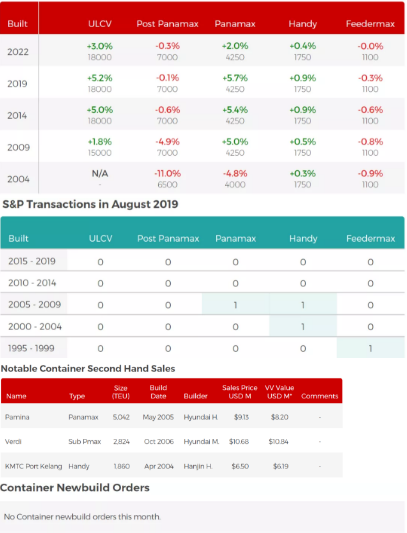
There has been limited activity in the Container sector with only smaller, older vessels changing hands.
This table shows the monthly % change in value from 1st to the 31st August 2019 for Container vessels, by year of build.
LPG
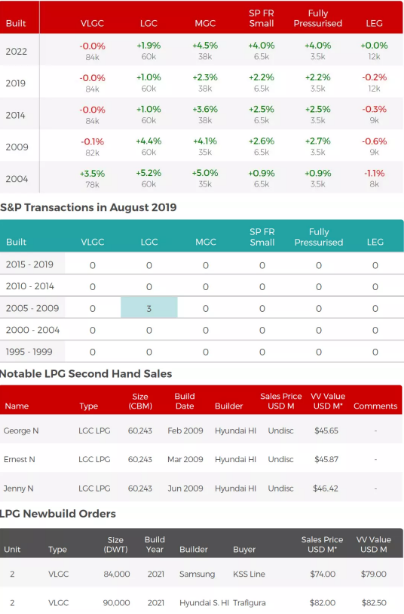
There has been little buying activity in the second hand LPG sector however Trafigura have placed an order for the worlds two largest VLGCs to date at 90,000 CBM, both fitted with dual fuel engines.
This table shows the monthly % change in value from 1st to the 31st August 2019 for LPG vessels, by year of build.
Offshore
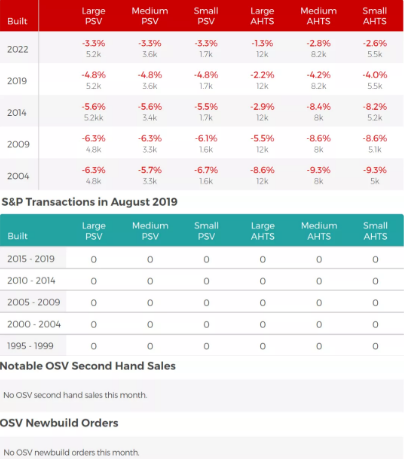
Little activity in the Offshore Sale and Purchase market this month. Values continue to remain at depressed levels for both AHTS and PSVs.
This table shows the monthly % change in value from 1st to the 31st August 2019 for OSV vessels, by year of build.
数据来源:VesselsValue 2019.09.02
*声明:本报告中包含的信息和意见是以VesselsValue认为可靠的信息源为基础,但对于信息的正确性、完整性和准确性或在其基础上进行的评估,VesselsValue不作任何保证或陈述。


